Figure 3.
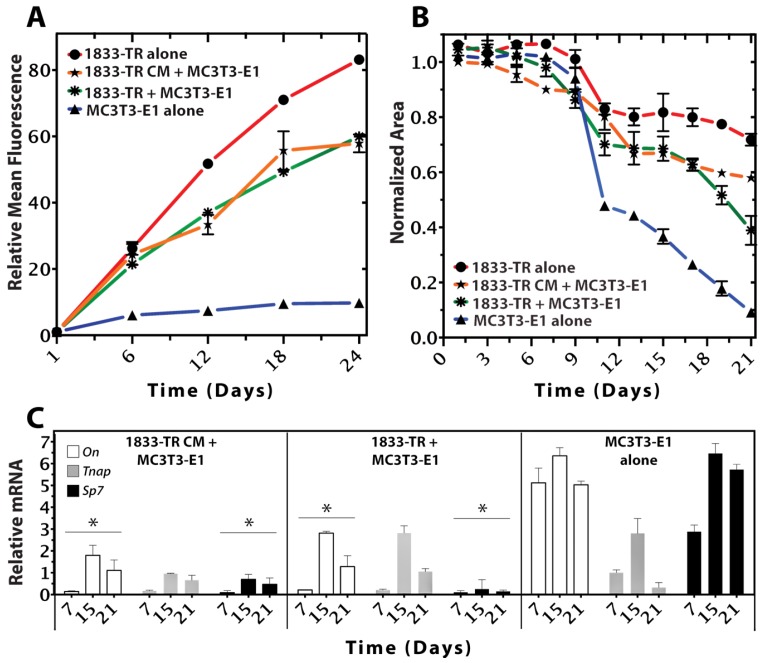
Cellular growth, survival, and differentiation within the 3D scaffold. (A) Resazurin-reduction (alamarBlue®) Assay (relative fluorescent intensity units) of cell-seeded constructs at days 1, 6, 12, 18, and 24 in culture. Metabolic activity of 1833-TR (circles), and to a lesser extent, co-cultures (stars) and 1833-TR CM (asterisks; with MC3T3-E1 cells present) increased with time in culture. In contrast, the metabolic activity of MC3T3-E1 cells alone (triangles) reached a plateau after day 12. Error bars indicate standard deviations of three independent experiments, each performed in triplicate per condition. (B) Cell-mediated gel contractility assays. Changes in relative surface area from the initial time point (day 0) to the subsequently indicated time points (days) are plotted. At day 12, an inflection point was observed in a cell-mediated gel-contractility assay for MC3T3-E1 alone, indicating that the construct was being remodeled by the cells to a greater extent than when 1833-TR cell or the medium that they conditioned was present. (C) RT-qPCR analyses of osteoblast differentiation markers (On, Tnap, SP7) normalized to GAPDH. The ratio of normalized gene expression for each marker (days 7, 15, 21) relative to the initial normalized expression values (day 0) are shown. Data revealed suppression of markers that indicate osteoblast differentiation with significance (* p < 0.05 On, Sp7; comparison to MC3T3-E1). Although alkaline phosphatase (Tnap) did not statistically decrease, a downwards trend by day 21 was evident.

