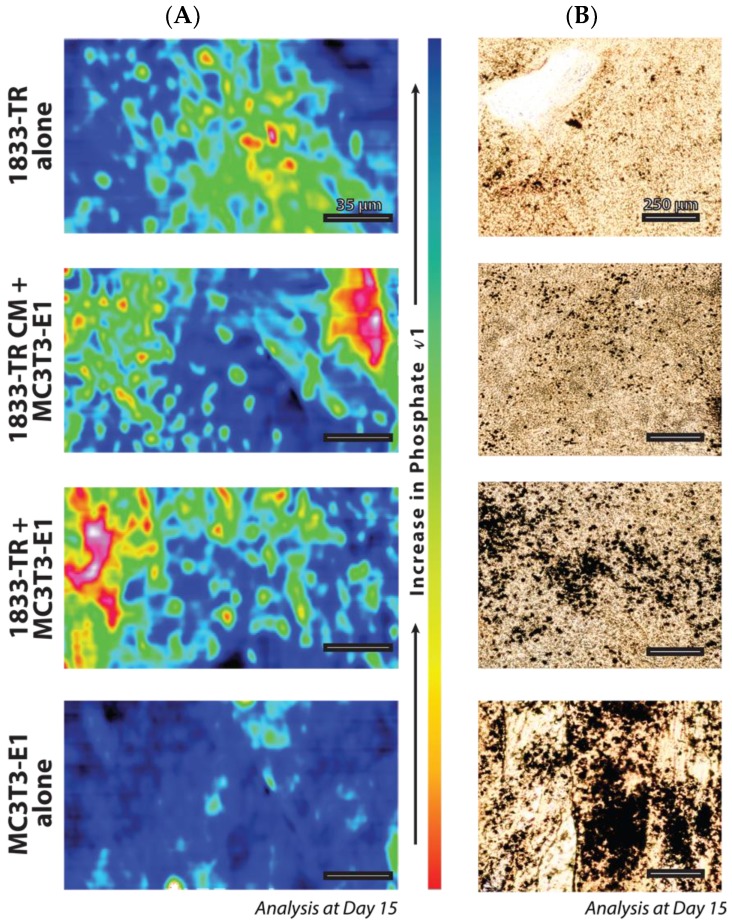
Figure 5.
Geometric positional arrangement. (A) FTIR microscopy in a 200 × 100 µm field of view for the v1 phosphate peak at day 15 in culture. Order of v1 phosphate peak presence: MC3T3-E1 > CO-CULTURE > CM CULTURE > 1833-TR. The legend present for the increase in phosphate v1 indicates blue (more phosphate, more mineralized), and the opposite polar end, red (less phosphate, less mineralized). (B) Silver staining to detect areas of mineralization.

