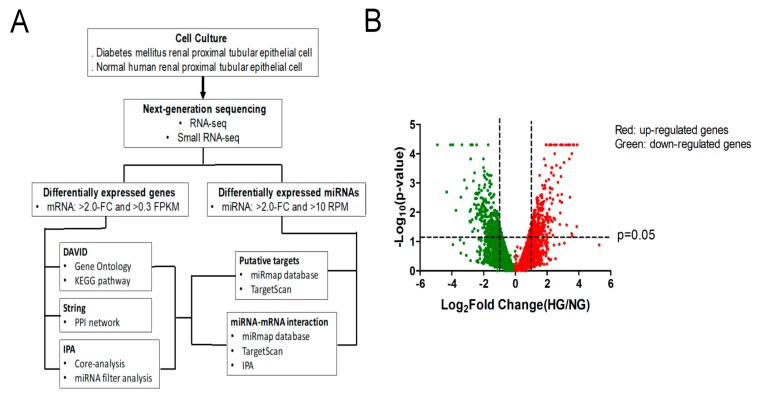
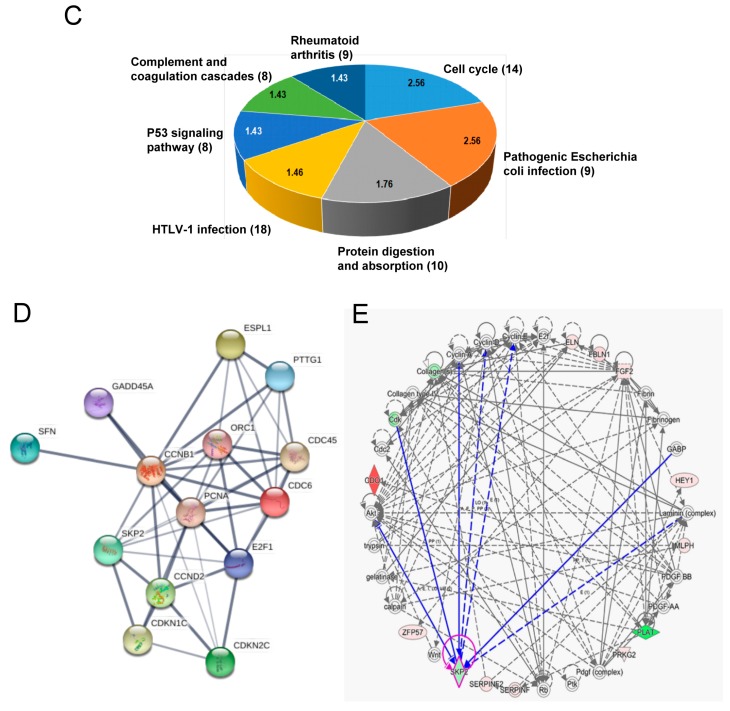
Figure 2.
Identification of potential genes associated with cell senescence in PTECs in DN. (A) Flowchart of identification of potential genes associated with cell senescence in PTECs. (B) Display of differential expression patterns of normal and diabetic PTECs from deep RNA sequencing by volcano plot. (C) The Kyoto Encyclopedia of Genes and Genomes (KEGG) pathway enrichment analysis of differentially expressed genes in DAVID database. The 612 differentially expressed genes in diabetic PTECs were uploaded into DAVID database for enrichment analysis. The top seven KEGG pathway analysis results of these dysregulated genes in diabetic PTECs are displayed in a pie chart. The pie chart indicates the-Log10 (false discovery rate, FDR) of each KEGG term, and the numbers that are shown at the outside of each pie segment indicates the number of genes involved in each term. (D) The protein-protein interaction network analysis of 14 genes associated cell cycle of KEGG pathway using STRING database. S-phase kinase protein 2 (Skp2) correlated with cell cycle markers, such as cyclin D2 (CCND2), cyclin B1 (CCNB1), cyclin-dependent kinase inhibitor 1C (CDKN1C), and CDKN2C. (E) The potential network of Skp2 mediating cell cycle in Core analysis of Ingenuity Pathway Analysis (IPA) software. Skp2 correlated with cyclins.


