Figure 6.
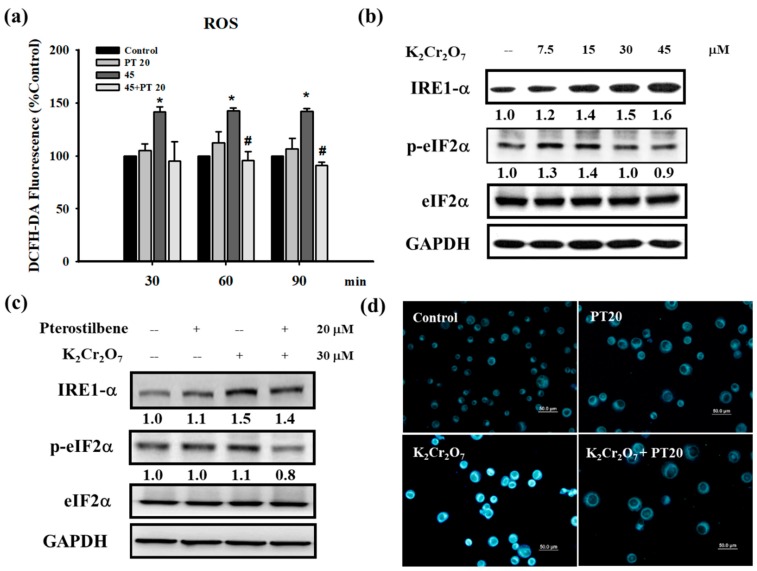
Cr(VI) treatment induced ROS and ER stress in HaCaT cells, which were inhibited by PT. (a) HaCaT cells were treated with 45 μM of Cr(VI) for various time periods (30, 60, and 90 min). The amount of ROS produced in cells was determined using the fluorescence dye (DCFH-DA) and analyzed by flow cytometry. Pretreatment with PT (20 μM) could suppress ROS generation. Fluorescence units reflected the subtraction of untreated cell values and were presented as the mean ± SD from three independent experiments. * p <0.05 versus control; # p <0.05 versus the Cr(VI)-treated group. (b) Cell lysates extracted from HaCaT cells treated with several concentrations (7.5, 15, 30, and 45 μM) of Cr(VI) for 24 h were submitted to Western blot analysis to detect the protein expression of ER stress. Cr(VI) upregulated IRE1α and p-eIF2α protein expressions but p-eIF2α decreased at 45 μM of Cr(VI). (c) HaCaT cells were treated with 30 μM of Cr(VI) for 24 h. Pretreatment with PT (20 μM) inhibited ER stress-related protein expression. Western blots are representative of n = 3 experiments. (d) HaCaT cells were treated with Cr(VI) (30 μM) for 24 h. The strength of the ER tracker was enhanced by Cr(VI) and alleviated by PT pretreatment. The scale bars are 50 μM.

