Figure 5.
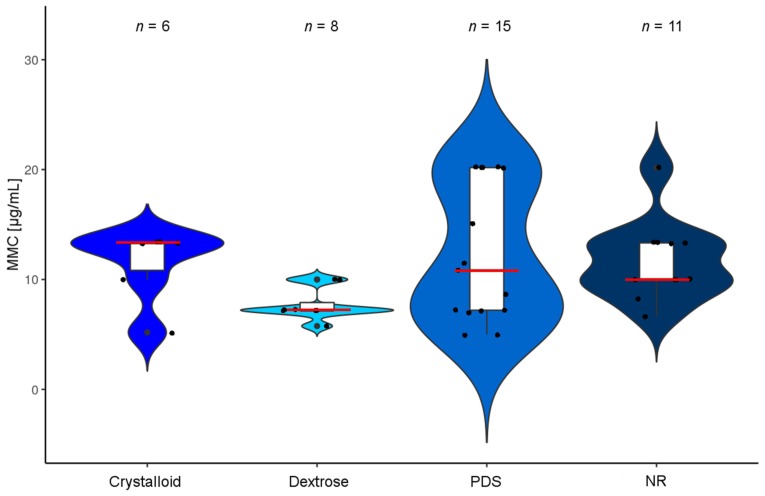
Drug concentration of MMC: The violin plot depicts concentrations of MMC as used in different HIPEC protocols. Protocols were categorized according to the matrix used to dilute drugs (crystalloid, dextrose, PDS or NR). Since there is lacking uniformity and for comparative reasons, we imputed data to a presumed average patient (with characteristics of 1.7 m height, 70 kg weight and 1.73 m2 body surface area). Further in the case of ambiguity values were maximized using the maximal drug amounts and the minimum diluent volumes reported. The red bars mark medians and white boxes interquartile range. Protocols with missing data or reporting ≤4 patients were omitted. (Median drug concentrations (µg/mL): crystalloid: 13.3; Dextrose: 7.2; PDS: 10.8; NR: 10). Abbreviations used: MMC (mitomycin c); PDS (peritoneal dialysis solution); and NR (not reported).

