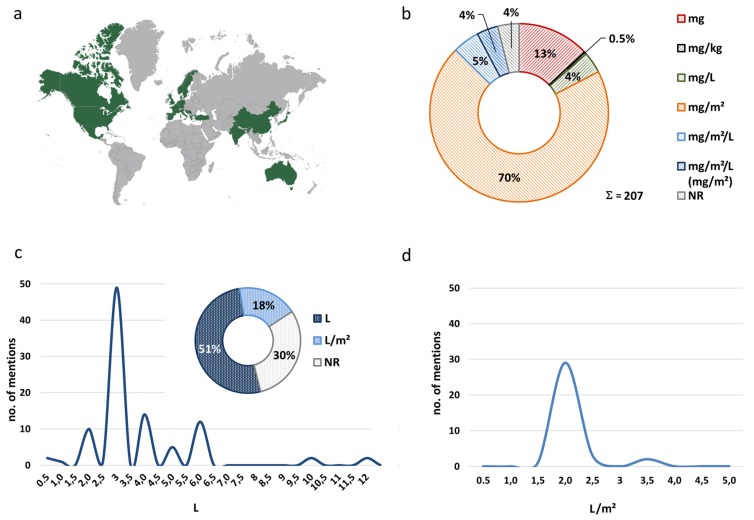
Figure 9.
Overview of manuscript provenience, dosage specifications, and volumes of diluents: (a) Provenience of authors reporting HIPEC conduct in PM from CRC (b) Designations used for benchmarking drug dosages. (c) Volumes of diluents used for abdominal perfusion in L (x-axis) plotted against the number of mentions in publications (y-axis). The pie chart depicts percentages of HIPEC reports mentioning diluent volumes in L, L/m2, or with no further specification (NR). (d) Volumes of diluent used in L/m2 (x-axis) plotted against the number of mentions in publications (y-axis). Numbers were rounded to one half of a percent. Abbreviations used: NR (not reported).

