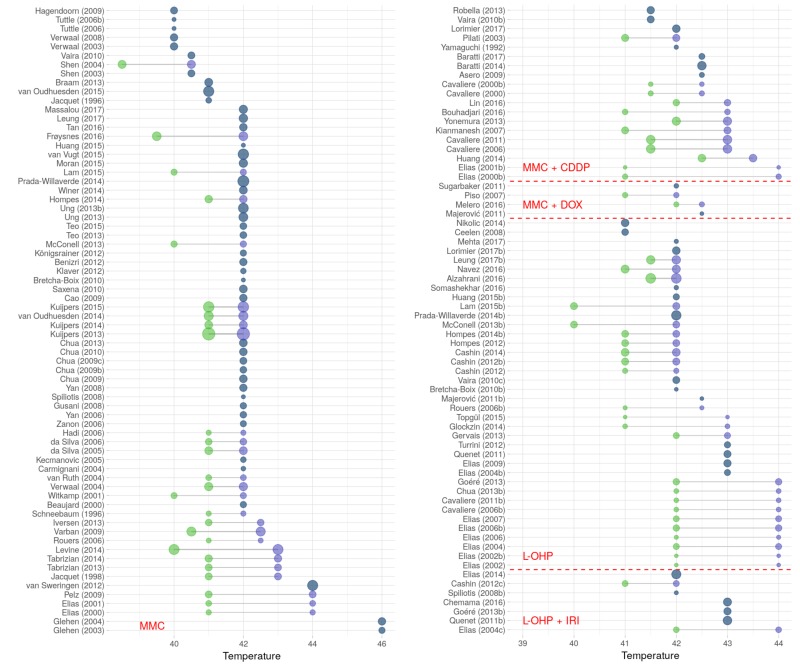
Figure 13.
Temperatures during HIPEC: The Lollipop plot depicts temperatures (in °C) reported for HIPEC protocols described in the literature (only reports with n > 4 patients and protocols containing MMC or L-OHP single drug or in combinations were included; temperatures ≥46 °C were assigned 46 °C). Green dots signify minimum temperature and purple dots maximum temperatures in case a range was reported. Symbols are lg scaled according to number of patients included. Publications conform to annotations given in Tables S1–S5, with Arabic letters marking chronological order (if required). Abbreviations used: CDDP (cisplatin); DOX (doxorubicin); IRI (irinotecan); L-OHP (oxaliplatin); and MMC (mitomycin c).

