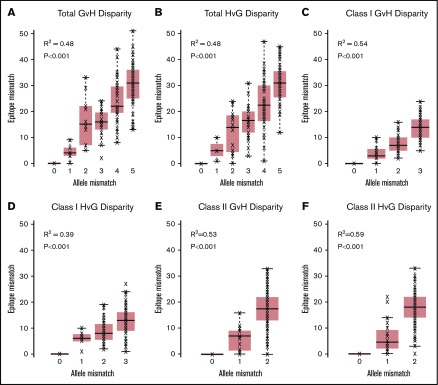
Figure 1.
HLA EM plotted against HLA AM. Total (A), class I (C), and class II (E) GVH disparities and total (B), class I (D), and class II (F) HVG disparities are shown. HLA EM correlated with AM in all classes and vector directions (R2 ranging from 0.39 to 0.59), but significant overlap existed between the ranges of EM for each level of AM in all categories.

