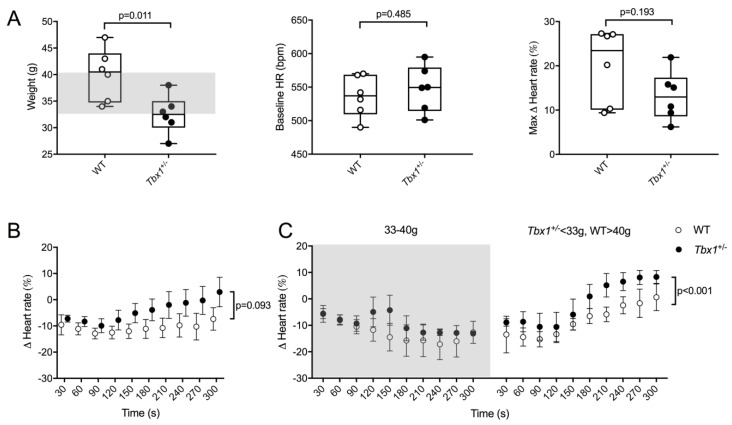
Figure 4.
(A) Box and whiskers plots of body weight, baseline HR and maximum HR change; (B) Heart rate recovery profile following administration of carbachol in 6 WT and 6 Tbx1+/− animals (CBC 0.1 mg kg−1 i.p.); (C) Heart rate recovery profile of animals categorised by weight. Shaded area represents range in between median weights of WT and Tbx1+/− animals.

