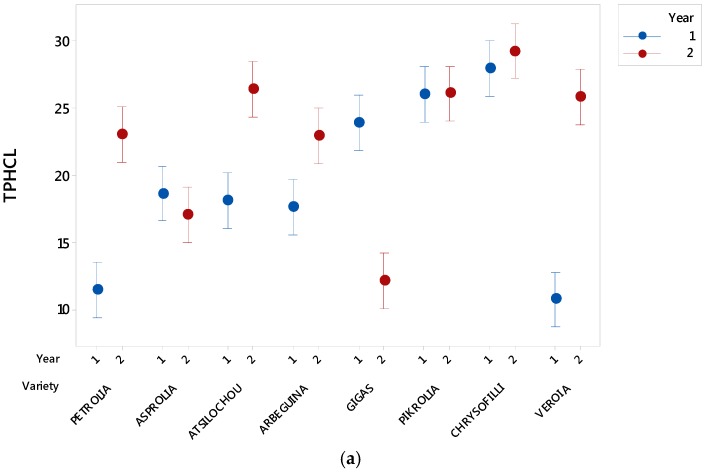
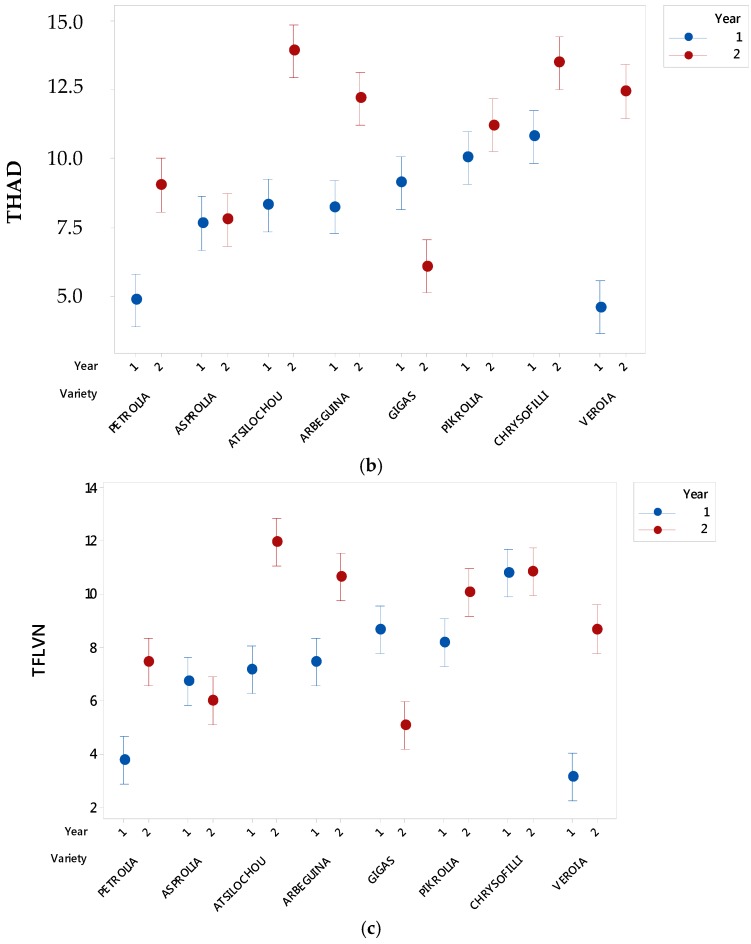
Figure A1.
Effect of year and variety on total phenol content determined via the alternative spectrophotometric assay (TPHCl), total hydroxycinnamic acid derivatives (THCAD), and total flavonols (TFLVN) contents. Vertical bars denote the 95% confidence intervals of means calculated from the error mean square of the analysis of variance. Means whose 95% intervals do not overlap differ statistically significantly.


