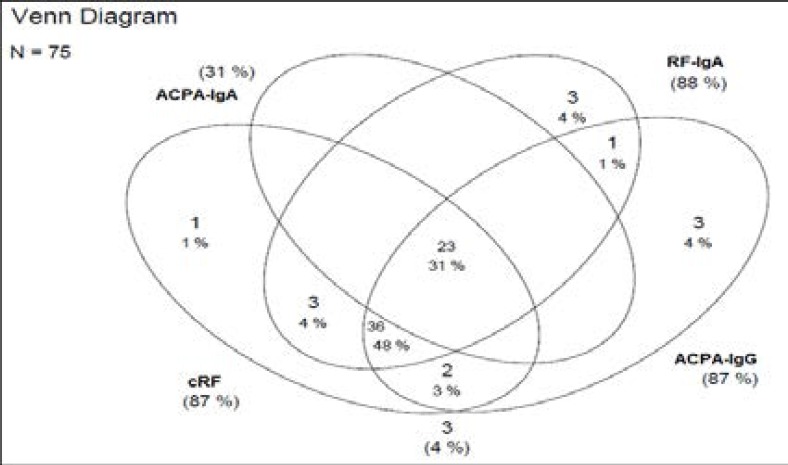
Figure 1.
Venn diagram of positive reactivity patterns of ACPA-IgG, cRF, ACPA-IgA RF-IgA individually as well as cross-reactivity patterns between these biomarkers.
The Venn diagram indicates that 31% (n=23) of RA patients had cRF and ACPA autoantibodies of both serotypes (IgG and IgA), while 48% (n=36) were positive for ACPA-IgG, cRF and RF-IgA, but not for ACPA-IgA.

