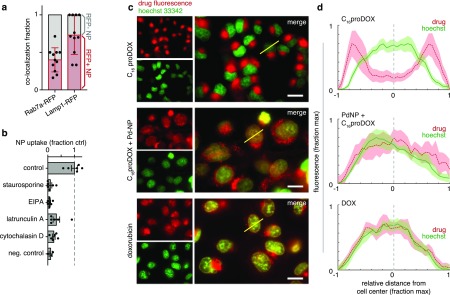
Figure 3.
Imaging reveals in vitro pathways of cell uptake and C16proDOX activation. (a) HT1080 tumor cells expressing either Rab7a-RFP or Lamp1-RFP fusion proteins were incubated with a fluorescently labeled NP based on the prodrug formulation (PLGA-PEG + PLGA-BODIPY630) and imaged 24 h later. Co-localization was determined by tabulating the fraction of NP-positive puncta (vesicles) in cells that contained high RFP expression or not (labeled red and gray, respectively; n > 10 cells, bars are mean ± std. dev.). (b) Following 30 min pretreatment with the indicated compounds, HT1080 cells were treated with the same NP as in (a) and imaged 3 h later (n > 6 biological replicates; mean ± s.e.m.). (c–d) HT1080 tumor cells were treated with C16proDOX, DOX, or Pd-NP with C16proDOX for 24 h and then imaged by fluorescence microscopy (representative images shown in (c)) to evaluate subcellular drug accumulation based on endogenous anthracycline fluorescence (scale bar, 20 μm). Yellow lines (c) denote representative examples of how fluorescence intensity profiles were quantified from line-scans through cells (d), shown as means (thick line) ± s.e.m. (shading; n > 10), for hoechst (green) and anthracycline fluorescence (red).

