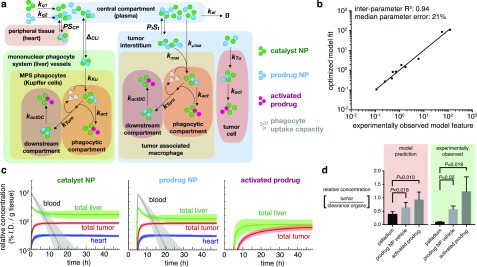
Figure 6.
A multicompartment pharmacokinetic model accurately reflects the benefits of the prodrug strategy. (a) Schematic depicting the computational pharmacokinetic model, with particle colors corresponding to the legend at right (Tables S1–S2 contain full equations and parameters). (b) Average fit of the computational model according to objective pharmacokinetic and biodistribution parameters that were experimentally measured (see Table S3). (c) Model simulation showing biodistribution of the catalyst, the prodrug (administered 5 h after the catalyst), and the activated prodrug over 48 h. Thick line and shading denote mean and std. dev. of simulations across n = 24 optimizations. (d) From data in (c), the modeled ratio of tumor: liver accumulation (n = 24) was compared to the experimentally observed ratio of tumor:clearance organs (liver, spleen, kidney; see Figure S7a for details; n = 3). Data are means ± s.e.m. (*paired two-tailed t tests).

