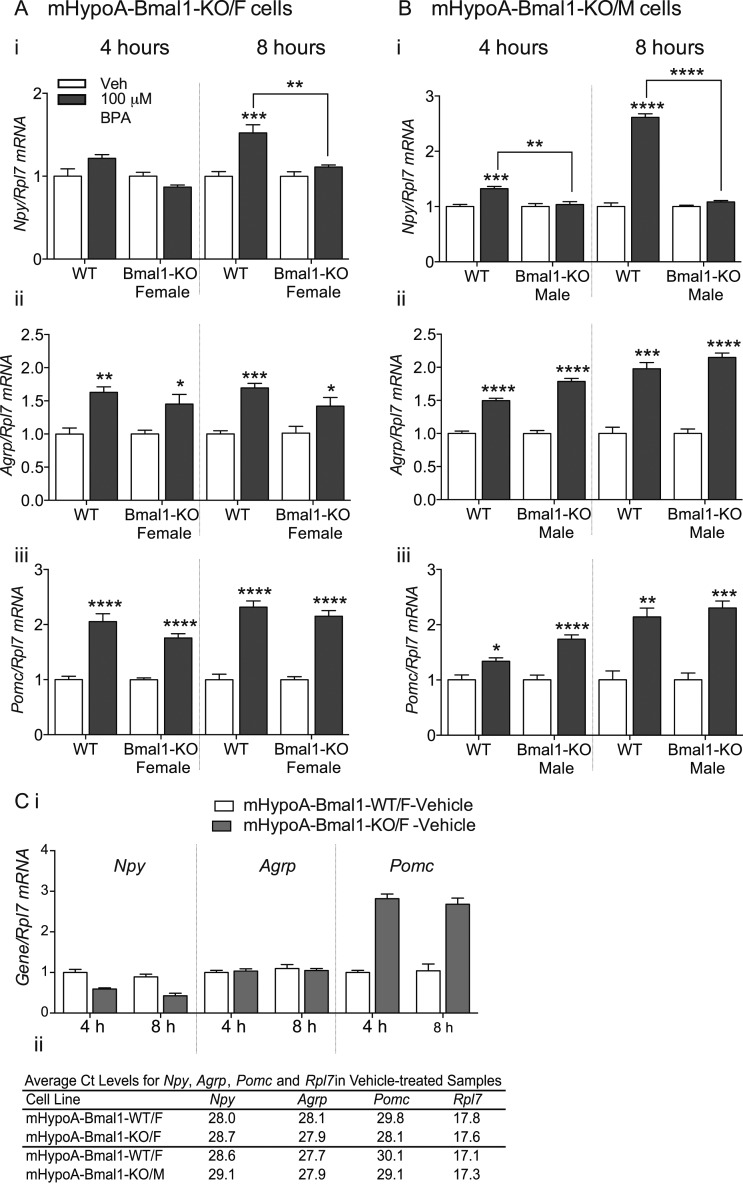
Figure 4.
BPA upregulates Npy,Agrp, and Pomc in mHypoA-Bmal1-WT/F cells, whereas the upregulation in Npy is absent in mHypoA-Bmal1-KO/F and mHypoA-Bmal1-KO/M cells. (A) mHypoA-Bmal1-KO/F (n = 4 to 5) and (B) mHypoA-Bmal1-KO/M (n = 6 for 4 hours, n = 3 for 8 hours) cells were treated with 100 µM BPA or vehicle (0.05% ETOH) for 4 or 8 hours alongside mHypoA-Bmal1-WT/F. (A i and B i) Npy, (A ii and B ii) Agrp, and (A iii and B iii) Pomc mRNA expression was quantified with qRT-PCR. Data are expressed as mean ± SEM. Statistical significance were determined with a two-way ANOVA, followed by the Tukey multiple comparison test. (C i) Npy,Agrp, and Pomc expression (n = 5) in mHypoA-Bmal1-KO/F cells compared with mHypoA-Bmal1-WT/F cells treated with vehicle (0.05% ETOH) for 4 or 8 hours. All groups are expressed relative to the 4-hour vehicle-treated mHypoA-Bmal1-WT/F group, which was normalized to 1. Data are expressed as mean ± SEM. (C ii) Mean cycle at threshold (CT) levels of Npy, Agrp, Pomc, and Rpl7 as measured by qRT-PCR in vehicle-treated mHypoA-Bmal1-KO/F or mHypoA-Bmal1-KO/M cells compared with mHypoA-Bmal1-WT/F cells that were treated in parallel. *P < 0.05; **P < 0.01; ***P < 0.001; ****P < 0.0001.

