
Fig. 1.
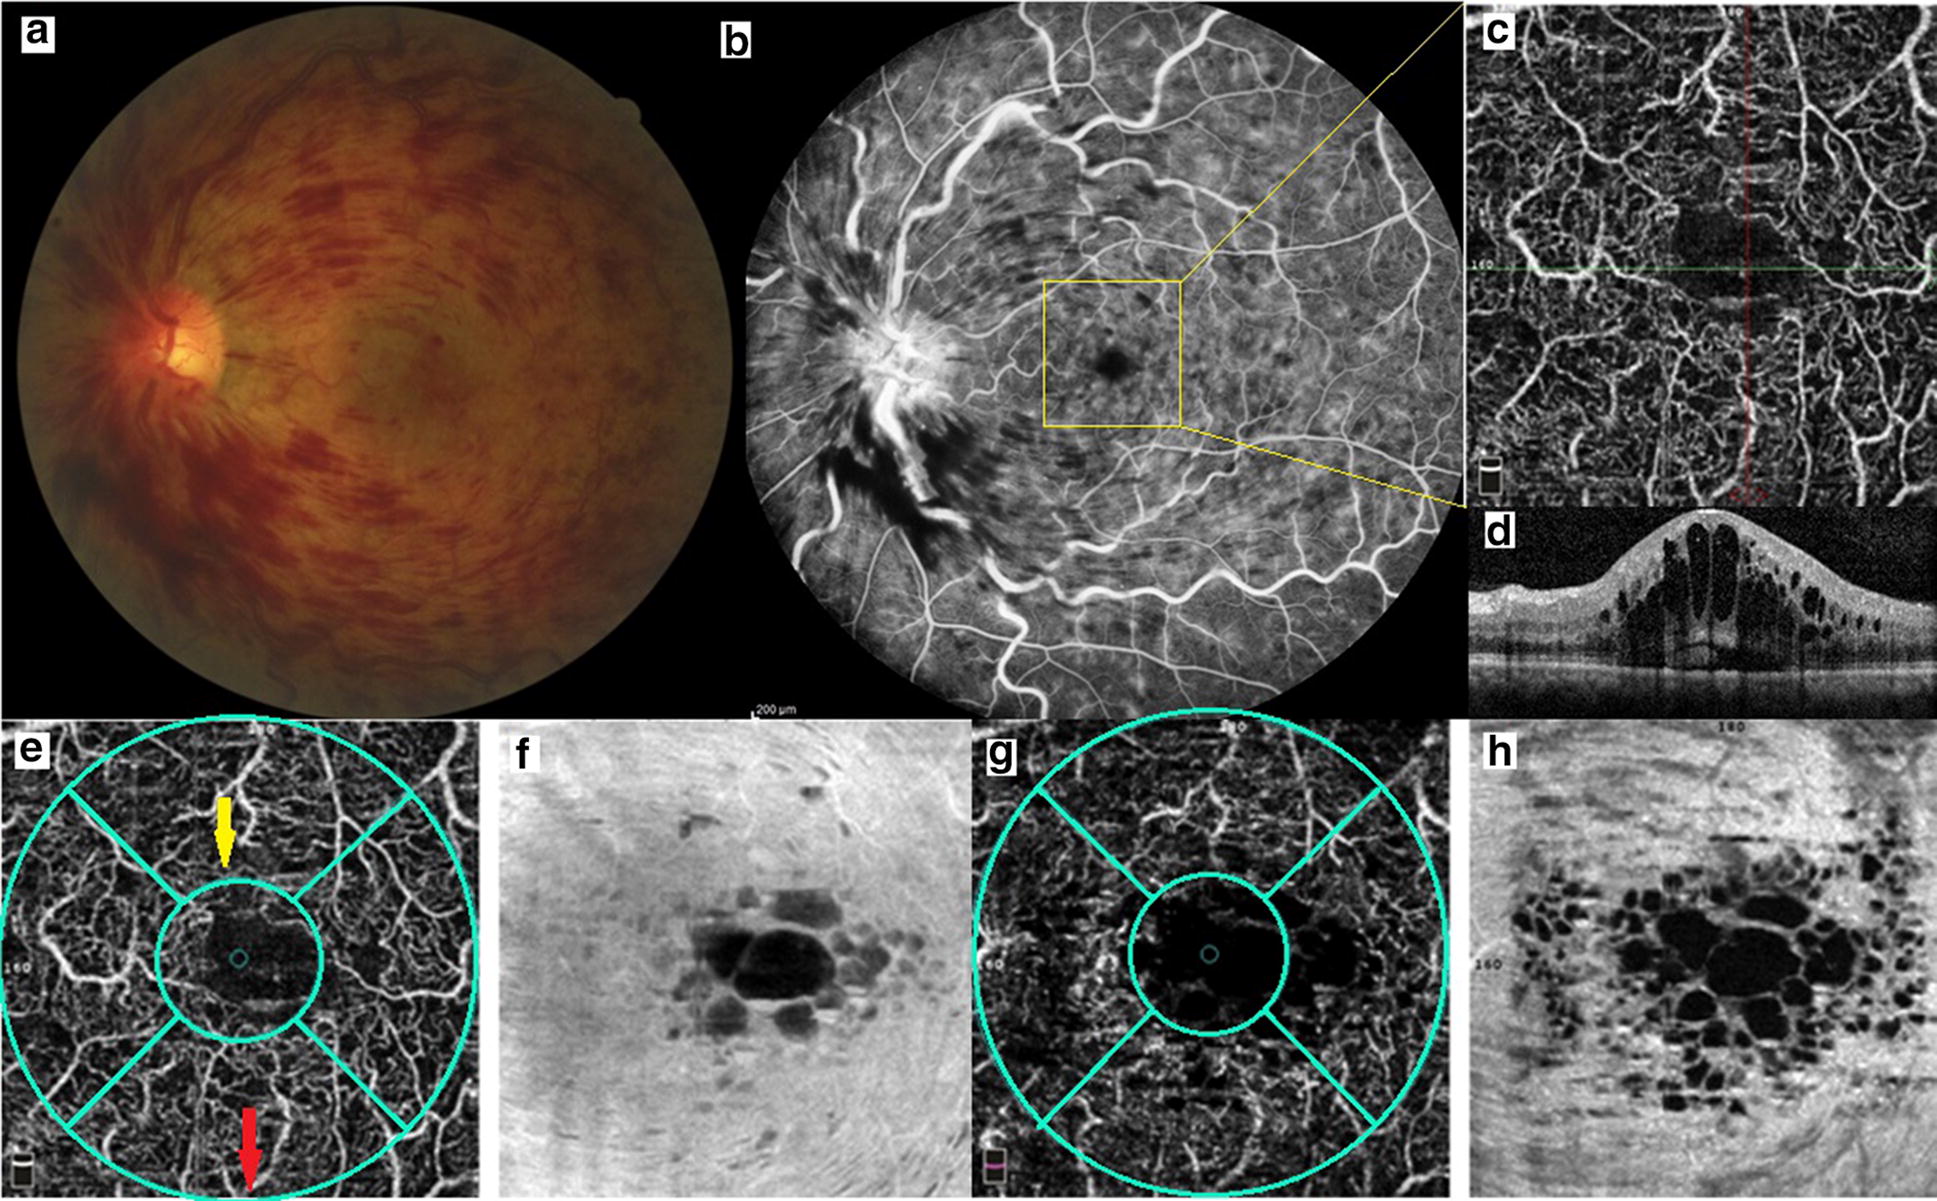
A patient with central retinal vein occlusion. a Fundus photograph, b fluorescein angiography, c optical coherence tomography angiography (OCTA) in superficial capillary plexus, d cystoids macular edema is observed in optical coherence tomography (OCT). e, g Whole vascular density (larger green circle: red arrow), foveal vascular density (small green circle: yellow arrow) and parafoveal vascular density (difference between 2 circles) were calculated in superficial and deep capillary plexuses in OCTA. f, h En face OCT at the level of superficial and deep capillary plexuses showed cystoids macular edema