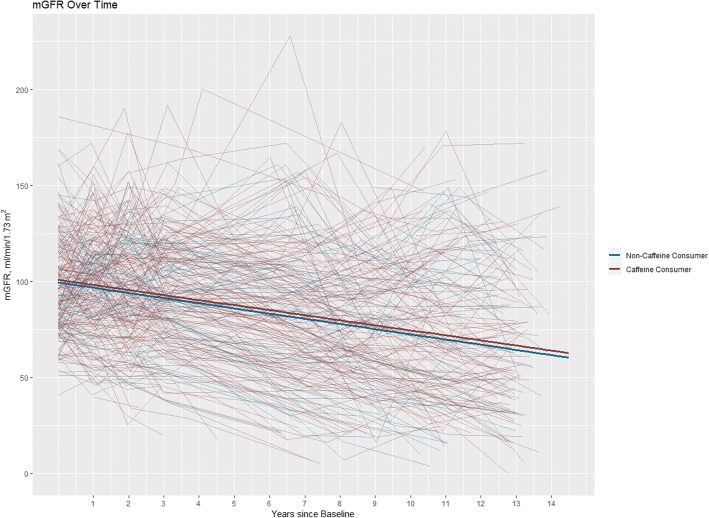
Fig. 3.
Spaghetti plot of mGFR over time for each individual patient (randomly jittered to preclude presentation of any individual’s actual data). The final adjusted model is overlayed (Model 2), showing the differences in slope and intercept for patients who reported consuming caffeine and patients who did not report consuming caffeine at baseline

