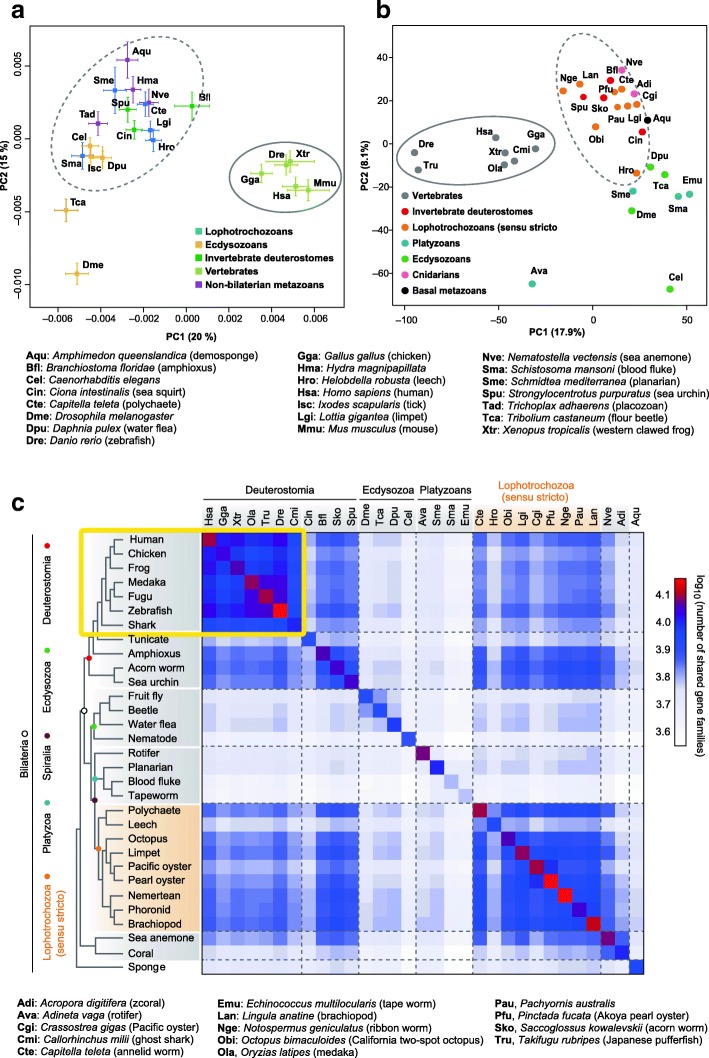
Fig. 4.
Clustering of metazoan gene family composition. Shown are the results of two independent analyses performed by (a) Simakov et al. [35] and (b, c) Luo et al. [61]. The first two principal components are displayed. a Principal component (PC) analysis of annotated gene functions. At least three clusters are evident, namely a vertebrate cluster (far right; solid-line circle); a non-bilaterian metazoan, invertebrate deuterostome, or spiralian cluster (center, top; dashed-line circle), and an ecdysozoan group (lower left). Drosophila and Tribolium (lower left) are outliers. b PC analysis of PANTHER gene family sizes. Invertebrate deuterostomes (Bfl, Sko, and Spu) cluster with lophotrochozoans (dashed-line circle). Solid-line circle denotes the clustering of vertebrates. In addition to the metazoan species analyzed in (a), the following species were included in the analysis. c Matrix of shared gene families among selected metazoans. The cladogram on the left is based on phylogenetic positions inferred from this study. Dashed lines separate the major clades. Note that tunicates (Cin) and leeches (Hro) share fewer genes with other bilaterians, probably because of their relatively high evolutionary rates and gene loss in each lineage

