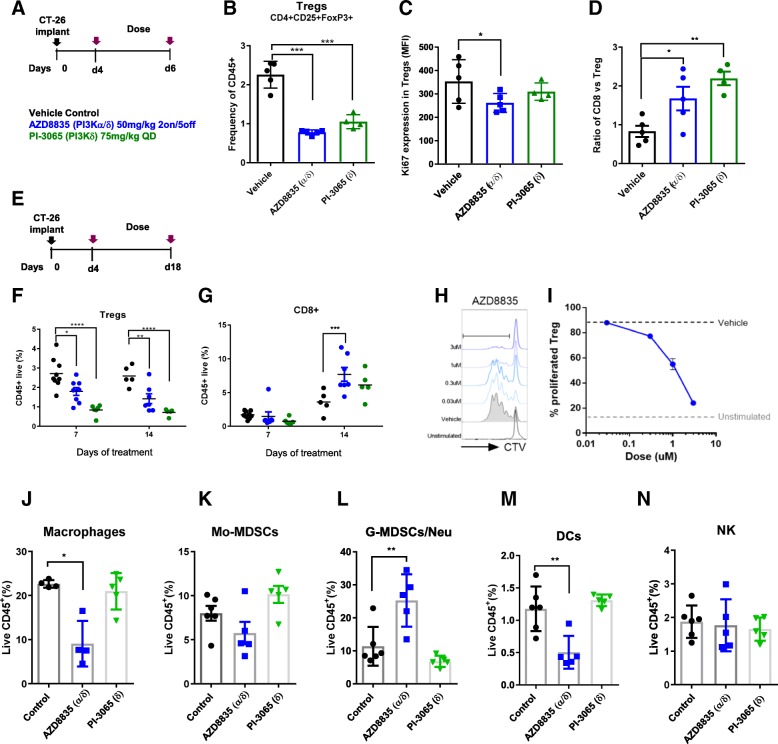
Fig. 2.
PI3Kα/δ directly suppress T-regs in vivo and increase CD8+ T-cell infiltration in CT-26 tumors. a Schematic depicts dose, schedule and experimental layout. b Scatter plots represent relative tumor T-regs cell frequencies relative to CD45+ cells. c Scatter plot showing levels of proliferation marker Ki67+ in tumor T-regs. d Scatter plots represent tumor CD8+/T-regs ratio. e Schematic depicts dose, schedule and experimental layout. f Scatter plots represent relative tumor T-cell frequencies of CD45+ T-regs and (g) CD8+ cytotoxic T-cells. h Histograms show representative CTV peaks for indicated drug concentrations. i Line graph shows the frequency of proliferated T-regs at indicated drug concentrations. Scatter plot shows relative quantification by flow cytometry of (j) Macrophages, (k) Mo-MDSCs, (l) G-MDSC/Neutrophil (m) Dendritic cells and (n) NK cells of treated and untreated tumors with AZD8835 (PI3Kα/δ) 50 mg/kg 2on/5off and PI-3065 (PI3Kd) 75 mg/kg QD for a period of 14 days. Data are representative of ≥2 experiments. Statistical significance is indicated as follows: *p ≤ 0.05, **p ≤ 0.01, ***p ≤ 0.001, ****p ≤ 0.0001

