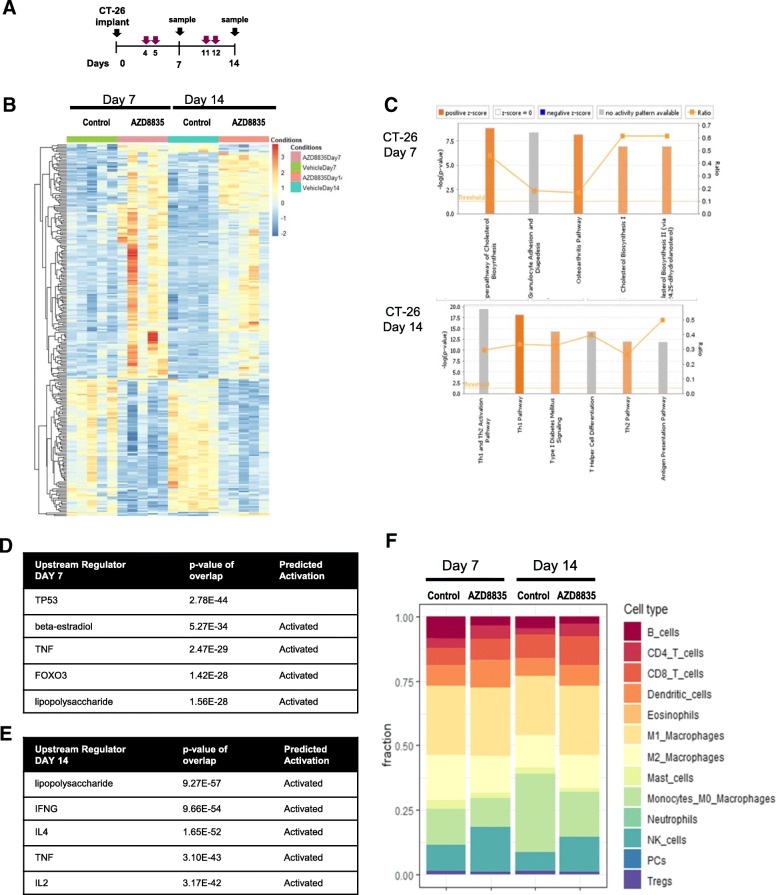
Fig. 3.
PI3Kα/δ inhibitor promotes and sustain strong pro-inflammatory responses in CT-26 treated tumors. a Schematic of dosing and sample collection. b Heat map analysis of 268 differential gene expression between control and treated groups. c Top canonical pathways regulated at day 7 and day 14 after implant. d List of top upstream regulator ordered by p values and annotated for activation prediction. e Quantification of immune cellular subtypes based on RNAseq gene signatures within control and AZD8835 treated samples. f Quantification of immune cellular subtypes based on gene signatures between control and AZD8835 treated samples at 7 and 14 days time points. Statistical significance is indicated as p values, n = 6/group

