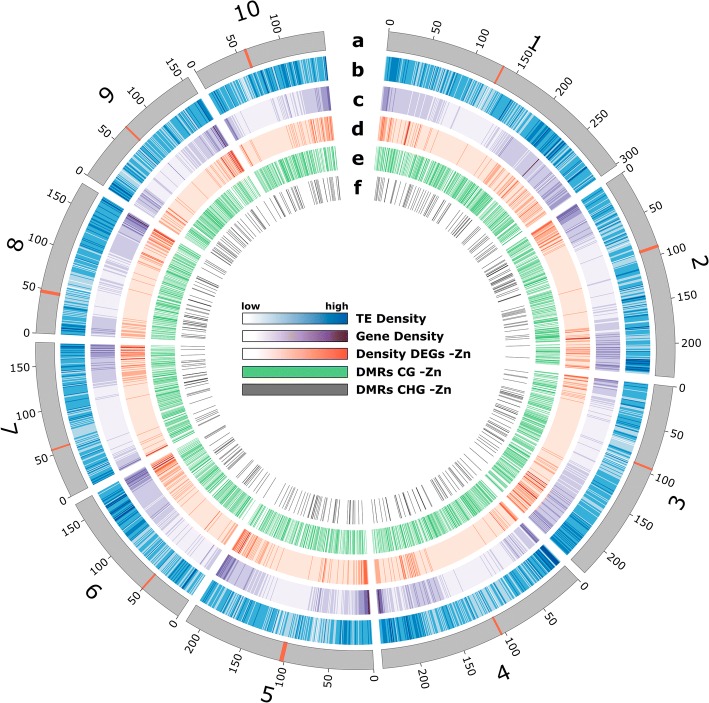
Fig. 5.
Distribution of different features across all 10 chromosomes of the B73 genome (a) Chromosomes (grey) with their centromere shown as red band. b Density of transposable elements (TEs, blue). c Gene density (violet). d Density of DEGs in -Zn (red). e Distribution of CG DMRs in -Zn (green). f Distribution of CHG DMRs in -Zn (dark grey)

