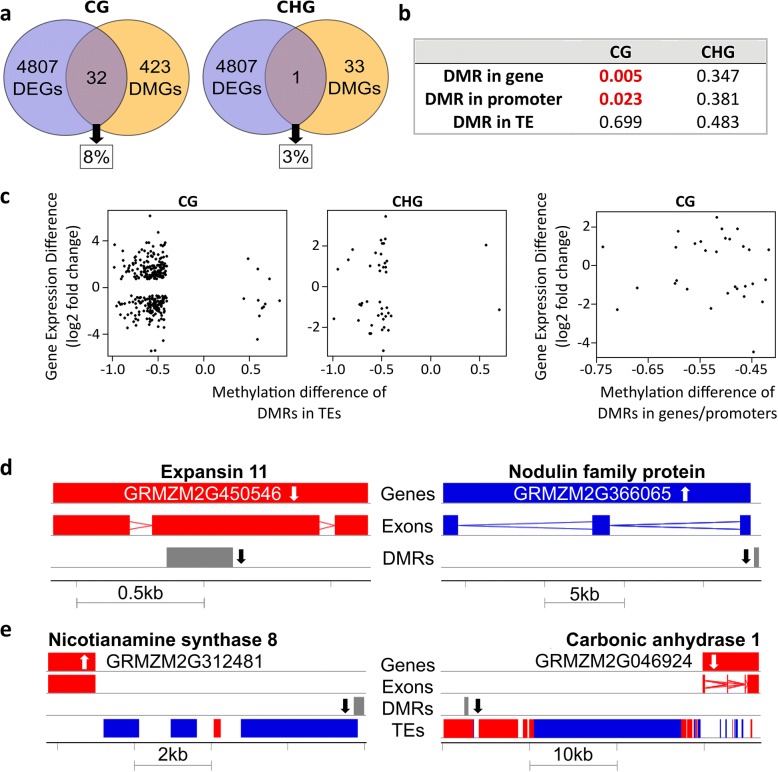
Fig. 6.
Relationship between gene expression and differential DNA methylation (a) Overlap between differentially expressed genes (DEGs) and differentially methylated genes (DMGs) in CG context (left) and CHG context (right). 8% or 3% of DMGs were also differentially expressed, respectively. b P values of Fisher’s exact test for correlations between DMRs in genes, promoters and neighboring TEs. c Scatterplots of differentially methylated genes that were also differentially expressed. Left: DMRs in adjacent TEs in CG context; middle: DMRs in adjacent TEs in CHG context; right: DMRs in promoters or gene bodies. d, e Examples for differentially methylated genes in CG context with differential expression. White arrow = gene expression up/down, black arrow = methylation up/down, red = forward strand, blue = reverse strand (d) DMRs in gene bodies/promoters of differentially expressed genes. e DMRs in TEs nearby differentially expressed genes

