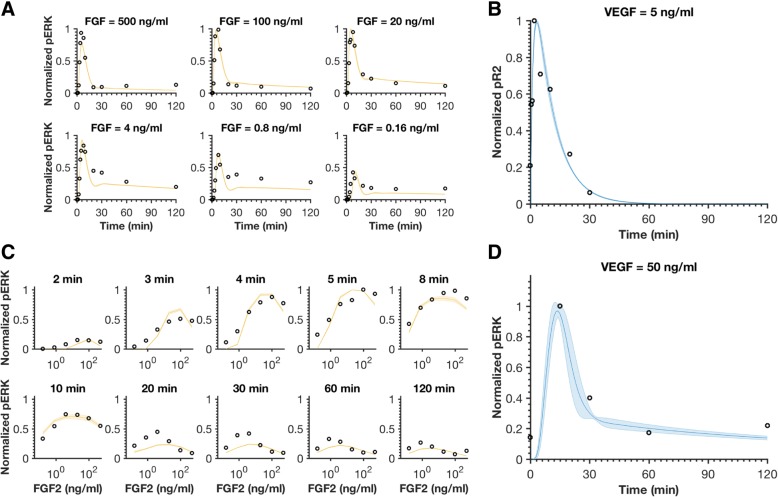
Fig. 2.
Model comparison to training data for FGF or VEGF stimulation. a Normalized pERK dynamics in response to FGF concentrations ranging from 0.16 to 500 ng/ml. b Normalized VEGFR2 phosphorylation time course following stimulation with 5 ng/ml VEGF. c Dose response of pERK for FGF stimulation. d Normalized ERK phosphorylation time course upon stimulation with 50 ng/ml VEGF. The circles are experimental data. Curves are the mean values of the 16 best fits. Shaded regions show standard deviation of the fits

