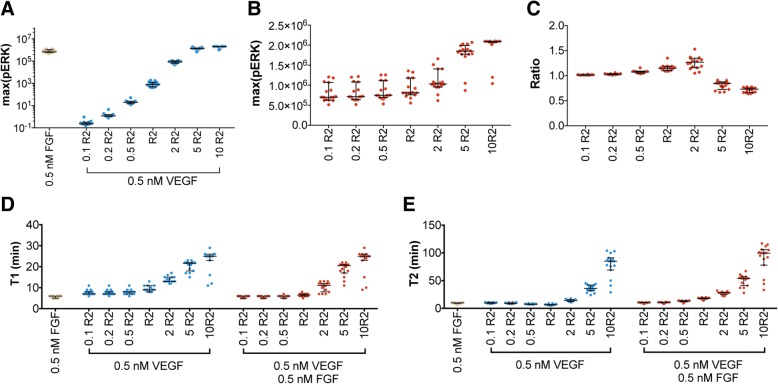
Fig. 6.
Predicted pERK response with varied initial VEGFR2 concentrations. a Maximum pERK induced by 0.5 nM FGF or 0.5 nM VEGF alone. b Maximum pERK induced by the combination of 0.5 nM FGF and 0.5 nM VEGF. c Ratio, R, of 0.5 nM FGF in combination with 0.5 nM VEGF. d T1, time to reach the maximum pERK in response to treatments. e T2, time that pERK is maintained above half of its maximum value in response to treatments. Yellow: FGF; Blue: VEGF; Red: combination. Each dot represents one fit. The dots are spread horizontally to avoid overlap of similar responses from different fits. Bars are median ± 95% confidence interval

