Fig. 3.
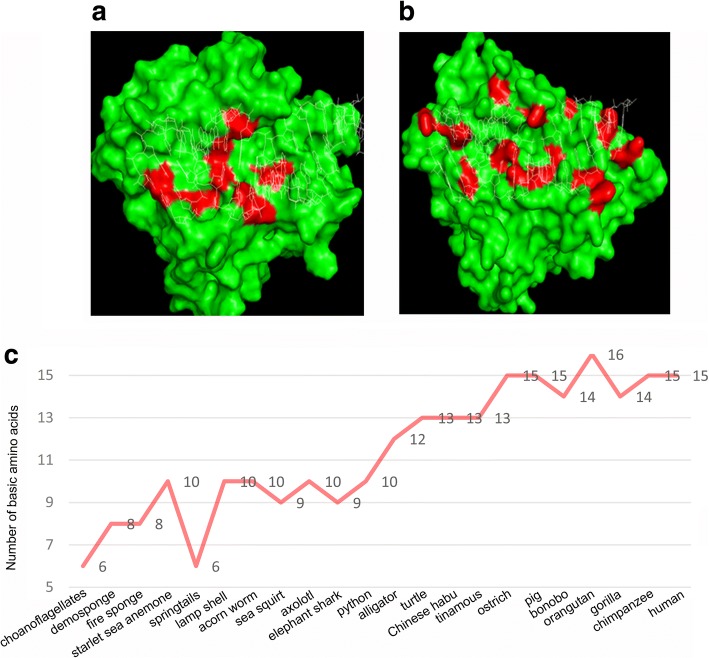
Numbers of basic residues on the OAS/dsRNA interaction interface increase during evolution. a, b Basic residues on the protein/dsRNA interface of demosponge OAS protein (left) and pig OAS1 protein (right). Basic residues and dsRNA are colored in red and white respectively. c Line chart of the number of basic residues on the OAS/dsRNA interface from lower to higher species

