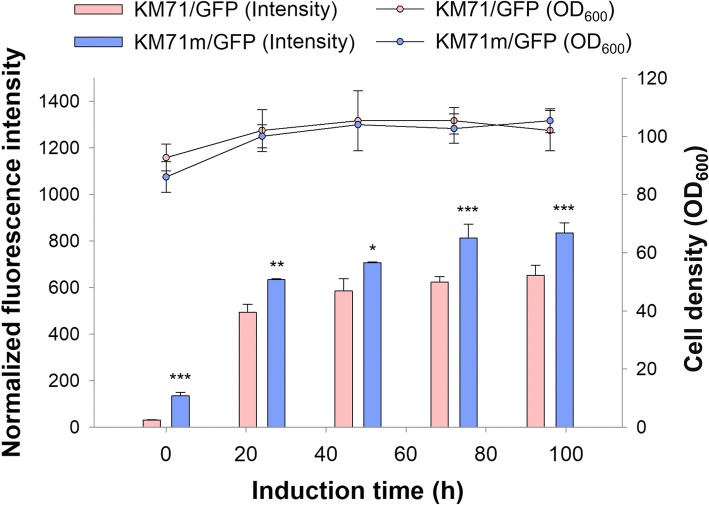
Fig. 1.
Mxr1-reprogrammed cells had altered GFP expression but did not show growth defects. After being cultured in BMGY (1% glycerol), cells were cultured in BMMY and induced with 0.5% methanol daily. Cell density (OD600) is presented by a line and scatter plot, and the normalized fluorescence intensity is presented by a bar plot. Error bars represent the standard deviation of three biological replicates. The independent-sample t-test was used to determine significance. *, p < 0.05; **, p < 0.01; ***, p < 0.005

