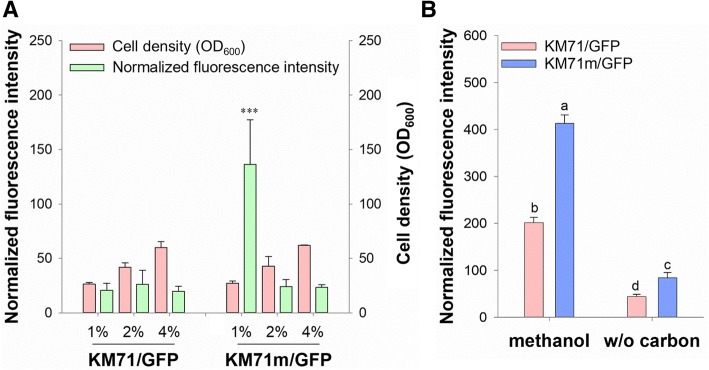
Fig. 2.
PAOX1 remained controllable in Mxr1-reprogrammed cells. a Detection of the cell density (OD600) and normalized fluorescence intensity of cells grown in different concentrations of glycerol for 24 h. The error bars represent the standard deviation of three biological replicates. Two-way analysis of variance (ANOVA) and the Tukey test were used to determine significance. ***, p < 0.005. b After being cultured in BMGY (2% glycerol), the cells were cultured in BMNY or BMMY. Detection of the normalized fluorescence intensity of cells grown in different carbon sources for 3 h. The error bars represent the standard deviation of three biological replicates. Two-way ANOVA and the Tukey test were used to determine significance. Groups with different letters are significantly different

