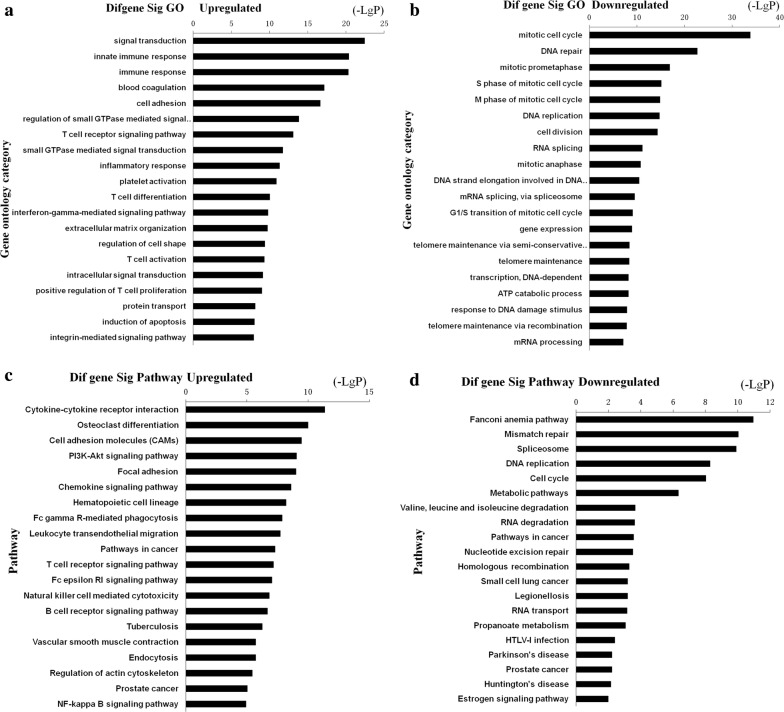
Fig. 3.
a, b Top 20 enrichment of GO terms for differentially expressed intersection genes (the bar plot shows the enrichment scores of the significant enrichment GO terms). c, d Top 20 enrichment of pathways for differentially expressed intersection genes (the bar plot shows the enrichment scores of the significant enrichment pathways)

