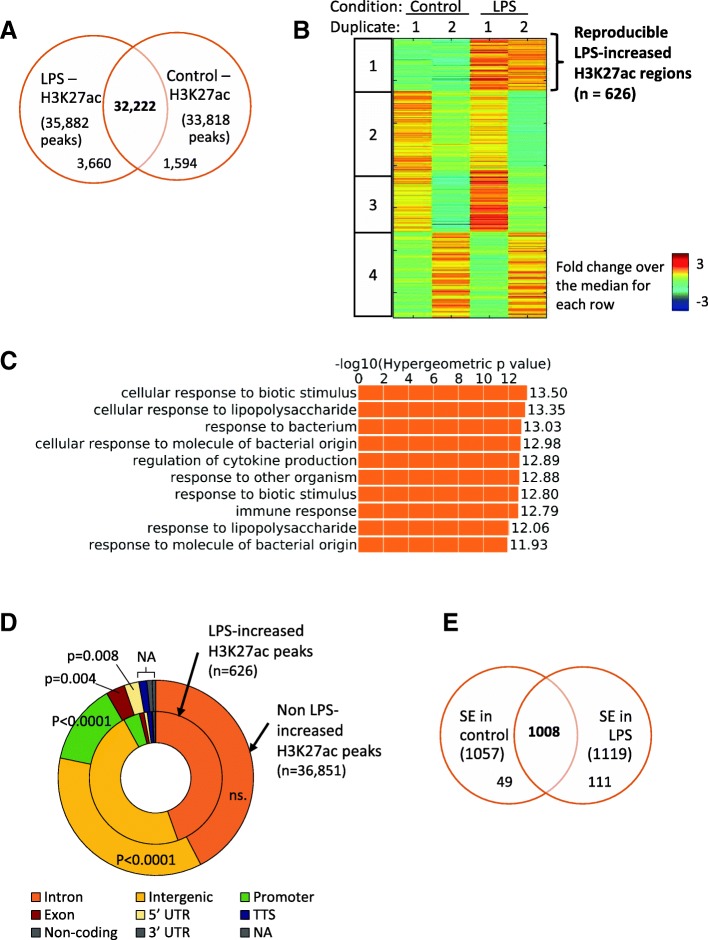
Fig. 1.
Identification and characterization of LPS-induced H3K27ac peaks. a: Overlap of H3K27ac peaks in Control and LPS condition. ChIP-seq experiment for H3K27ac was performed after treating Detroit 562 cells with LPS at 1μg/ml or fresh medium (Control) for 100 min. Final reproducible peaks identified in each condition were compared, two peaks were considered overlapping when their summit was located less than 1000 bp apart. b: Identification of LPS-increased H3K27ac peaks. H3K27ac ChIP-seq data from two replicates under no (Control) or LPS treatment were used to measure the signal intensity and perform differential binding analysis. Differential peaks were further clustered into 4 groups. c: Gene ontology analysis. LPS-increased peaks were associated to their single closest gene and Gene Ontology analysis was performed using all H3K27ac peaks identified as background. Top 10 biological processes terms are reported. D: Annotation of H3K27ac regions. LPS-increased (inside ring) and non LPS-increased (outside ring) H3K27ac peaks were assigned to the genomic feature they were located into. Proportion of each feature are represented. Comparison between the two sets of peaks was performed using a Chi-square test and the pearson P-values are reported. E: Overlap of Super-Enhancers. Super-enhancers (SE) identified in LPS and Control conditions were compared, two peaks were considered overlapping if they have at least 1 bp in common

