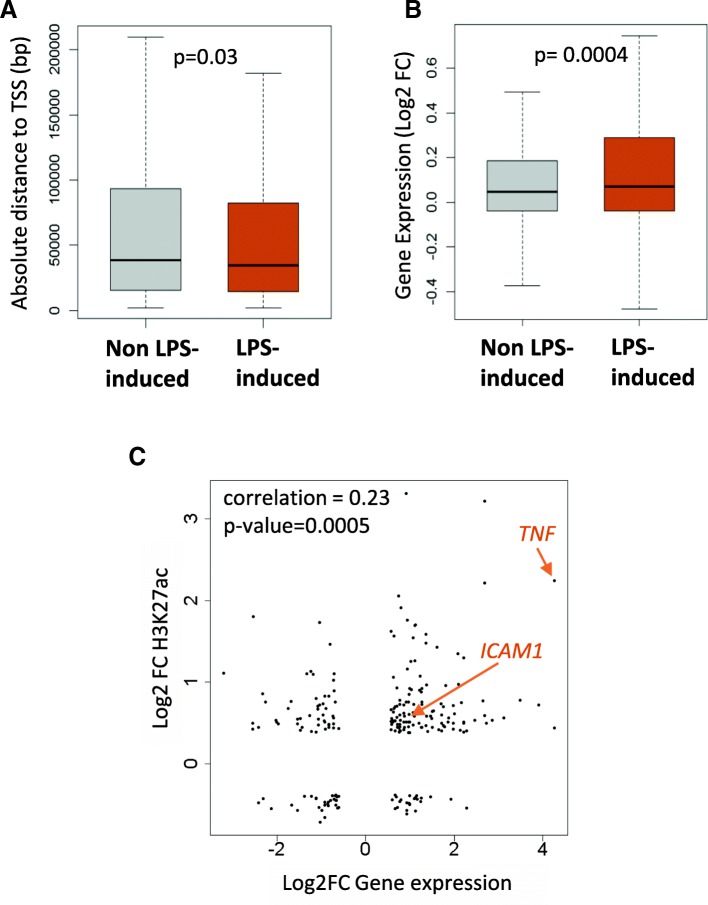
Fig. 2.
LPS-induced Hac and gene expression. a: Distance to the closest TSS. The distances were extracted for LPS-increased (orange) and non LPS-increased (grey) H3K27ac peaks. Only peaks outside of promoter regions (defined as -2Kb to +2Kb around the transcription Start Site) were considered. b: H3K27ac and gene expression. Each H3K27ac peak was assigned to the closest gene located within 1000Kb of the peak border. Expression of the genes associated with LPS-increased (orange) and non LPS-increased (grey) H3K27ac peaks was investigated. Difference between the two groups in A and B was tested with a Wilcoxon test for which the P-value is reported. c: Correlation between changes in H3K27ac gene expression. For each H3K27ac peak, the Log2 fold in expression of the genes assigned to it (x axis) was plotted against the Log2FC in H3K27ac ChIP-seq signal (y axis) after LPS stimulation. Correlation between these two data sets was tested with a Pearson test, the correlation coefficient together with the P-value is reported

