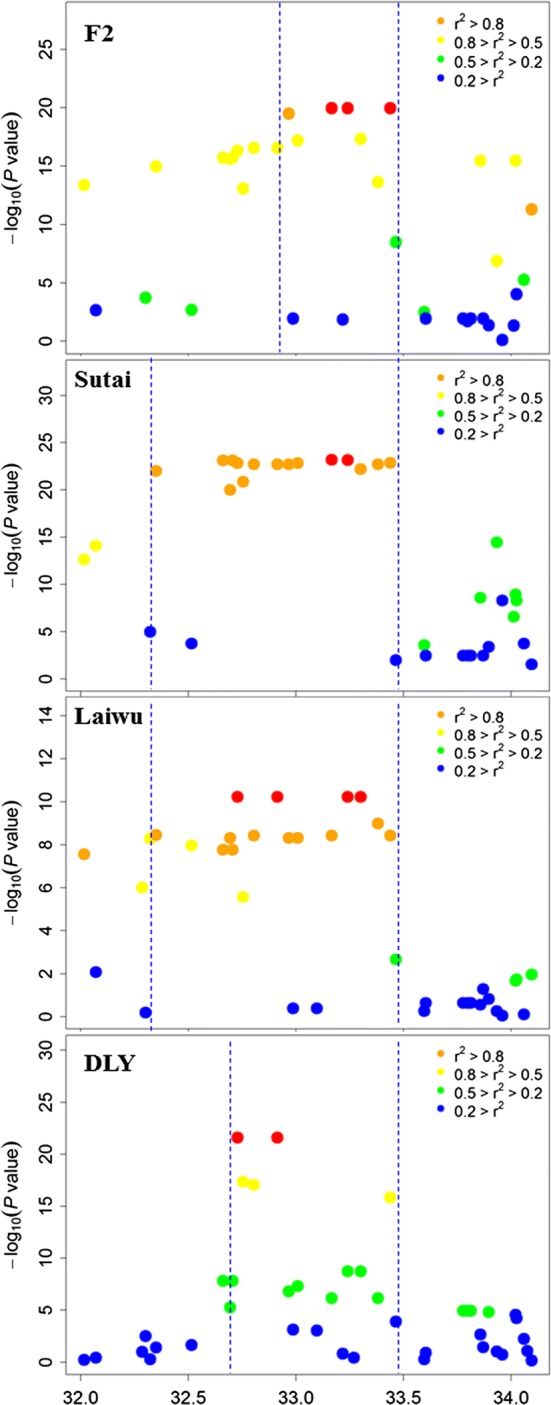
Fig. 2.

Regional Manhattan plots for association analyses around the QTL for ear size on chromosome 5 in four pig populations. The top SNPs are highlighted by red dots. Different levels of linkage disequilibrium (LD based on r2) of the top SNPs with surrounding SNPs are indicated by different colors. The QTL intervals indicated by dashed lines were defined by the 2 drop-off of LOD value and r2 ≥ 0.8. Their overlapping region spans 509.28 kb between 29.74 and 30.25 Mb on chromosome 5
