
Fig. 2.
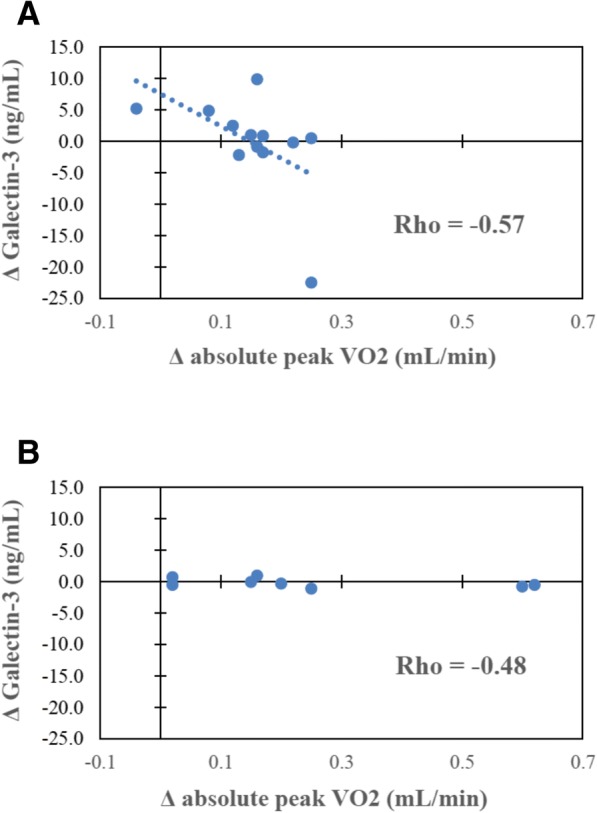
Plasma galectin-3 correlations before and after high-intensity interval training (HIIT). a Scatter plot depicting relationships between change in plasma galectin-3 (y-axis) and change in absolute peak VO2 (x-axis) following exercise training in the rheumatoid arthritis group (n = 12; r = −0.57; P = 0.05). b Scatter plot depicting the Spearman’s correlation coefficient for change in plasma galectin-3 (y-axis) and change in absolute peak VO2 (x-axis) following exercise training in the prediabetes group (n = 9; r = −0.48, P = 0.23), Fisher r-to-z P = 0.81. Abbreviation: VO2 maximal oxygen consumption