
Fig. 1.
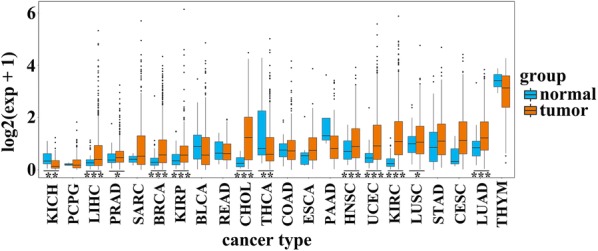
PD-1 expression between cancer samples and normal samples of 22 types of cancer. The expression of PD-1 in LIHC, PRAD, BRCA, KIRP, CHOL, HNSC, UCEC, KIRC, LUSC, and LUAD was upregulated, while it was downregulated in KICH and THCA (P < 0.05). Because of small size of normal tissue samples, eleven cancer types were excluded for expression profile analysis between tumor tissue samples and normal tissue samples. *P < 0.05, **P < 0.01, ***P < 0.001