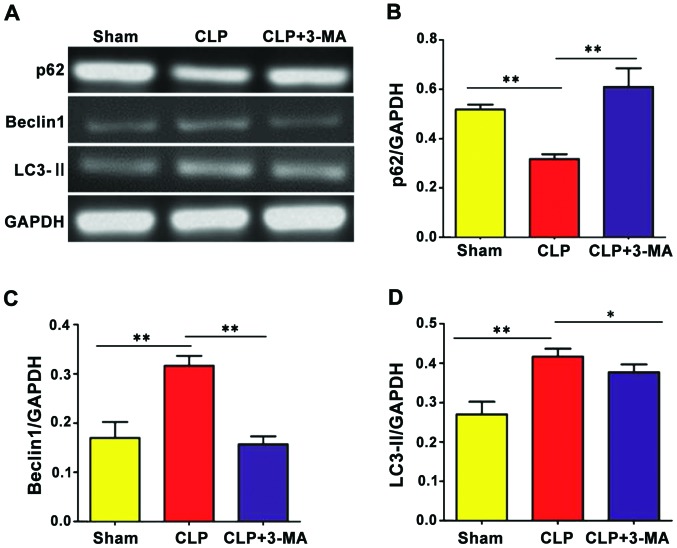
Figure 5.
Reverse transcription-semi-quantitative PCR to detect the expression of autophagy-related genes. The expression levels of the autophagy-related genes (A and C) Beclin1 and (A and D) LC3-II were significantly increased in CLP group compared with those in the sham group (**P<0.01), while (A and B) the expression level of p62 was significantly decreased (**P<0.01). Compared with CLP group, the expression levels of (A and C) Beclin1 and (A and D) LC3-II were decreased in CLP+3-MA group (**P<0.01, *P<0.05), while (A and B) the expression level of p62 was increased (**P<0.01, *P<0.05), n=12.

