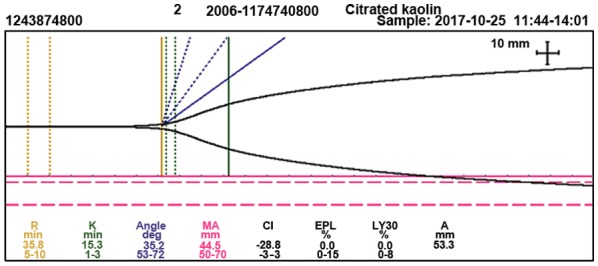
Figure 3.

Thromboelastography showing a prolonged R-time (35.8 min) and K-time (15.3 min), a narrowed angle (35.2°), decreased MA (44.5 mm), decreased CI (−28.8) and normal clot lysis, which is reported in terms of EPL (0.0%) and LY30% (0.0%). R, reaction time; K, coagulation time; deg, degree; MA, maximum amplitude; CI, coagulation index; EPL, estimated percent lysis; LY30%, percent clot lysis at 30 min after maximum amplitude; A, amplitude.
