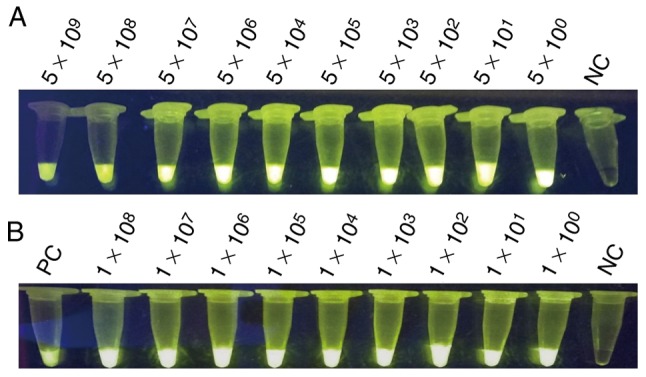
Figure 5.

Visualization of LAMP. (A) Sensitivity of the LAMP assay for detecting the target gene of hypothetical protein gene; the templates were the positive plasmids, serially 10-fold diluted as 5×10⁹, 5×10⁸, 5×10⁷, 5×10⁶, 5×10⁵, 5×10⁴, 5×10³, 5×10², 5×101 and 5×10° per reaction. (B) Sensitivity of the LAMP assay for detection of the hypothetical protein gene; the templates were mixed with mouse blood, serially 10-fold diluted as 1×10⁸, 1×10⁷, 1×10⁶, 1×10⁵, 1×10⁴, 1×10³, 1×10², 1×101 and 1×10° per reaction, respectively, with positive plasmids as the template as PC. LAMP, loop-mediated isothermal amplification; PC, positive control; NC, negative control.
