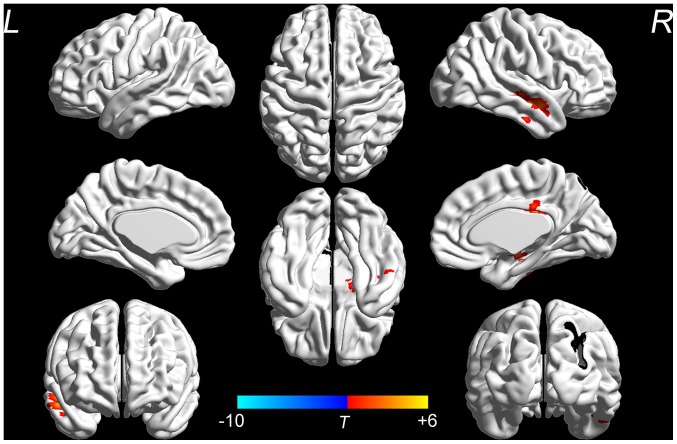
Figure 3.
ALFF results of brain regions demonstrate significant differences in the control group pre- and post-intervention. The 3D pseudo-color map revealed increases in ALFF following the intervention (red). Results are displayed at P<0.05 corrected by AlphaSim. ALFF, amplitude of low-frequency fluctuation; L, left; R, right. T, T value obtained from paired t-test of the control group.

