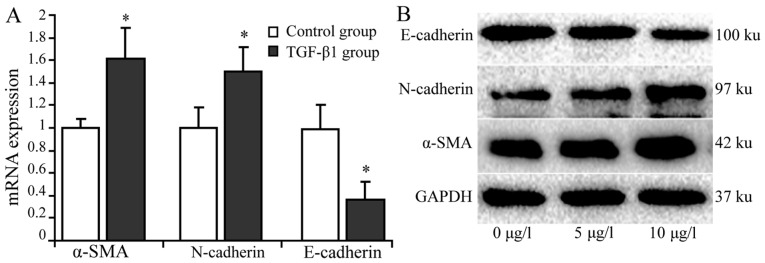
Figure 3.
Expression of α-SMA, N-cadherin and E-cadherin in hepatic stellate cells induced with 10 µg/l TGF-β1. mRNA and protein expression levels of α-SMA, N-cadherin and E-cadherin were determined in hepatic stellate cells using reverse transcription-quantitative polymerase chain reaction and western blot analysis. (A) mRNA Expression of α-SMA, N-cadherin and E-cadherin in hepatic stellate cells treated with 10 µg TGF-β1. (B) Protein expression of α-SMA, N-cadherin and E-cadherin in hepatic stellate cells with different of TGF-β1 concentrations. *P<0.05 vs. the control group.

