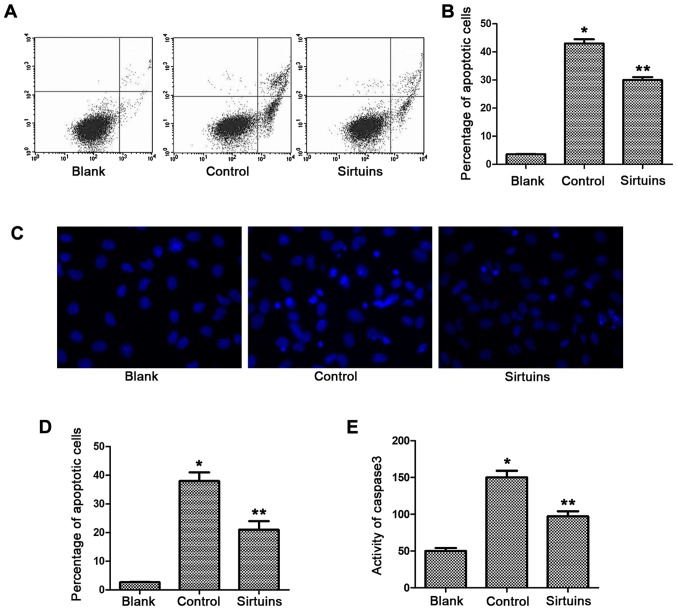
Figure 1.
Detection of apoptosis level in each group. (A) Detection of proportion of apoptotic cells in blank, control and sirtuins groups via flow cytometry. (B) Statistical results of proportion of early apoptotic cells in three groups. (C) Detection of number of cells with karyopyknosis and karyorrhexis in blank, control and inhibitor groups via Hoechst staining. (D) Statistical results of number of cells with karyopyknosis and karyorrhexis in three groups. (E) Detection of caspase-3 activity via enzyme-linked immunosorbent assay (ELISA). *P<0.05 vs. blank group, **P<0.05 vs. control group.

