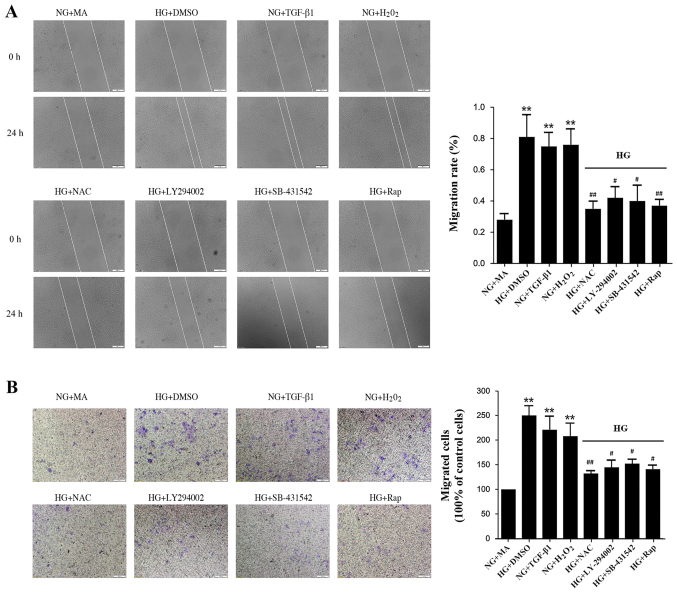
Figure 4.
Effects of HG and different factors on cell migration and invasion. (A) The cell monolayer was wounded using a 200 ml yellow pipette tip followed by treatment with different factors for 24 h. The number of the cells in the denuded zone was quantified under an inverted microscope. White lines indicate the wound edge. Magnification, ×100. (B) Invading cells were stained with hematoxylin and eosin and quantified. Magnification, ×200. **P<0.01 vs. NG+MA; #P<0.05 and ##P<0.01 vs. HG+DMSO. HG, high glucose (60 mmol/l); NG, normal glucose (5.56 mmol/l); MA, mannitol; DMSO, dimethylsulfoxide; TGF, transforming growth factor; NAC, N-acetylcysteine; Rap, rapamycin.

