Figure 2.
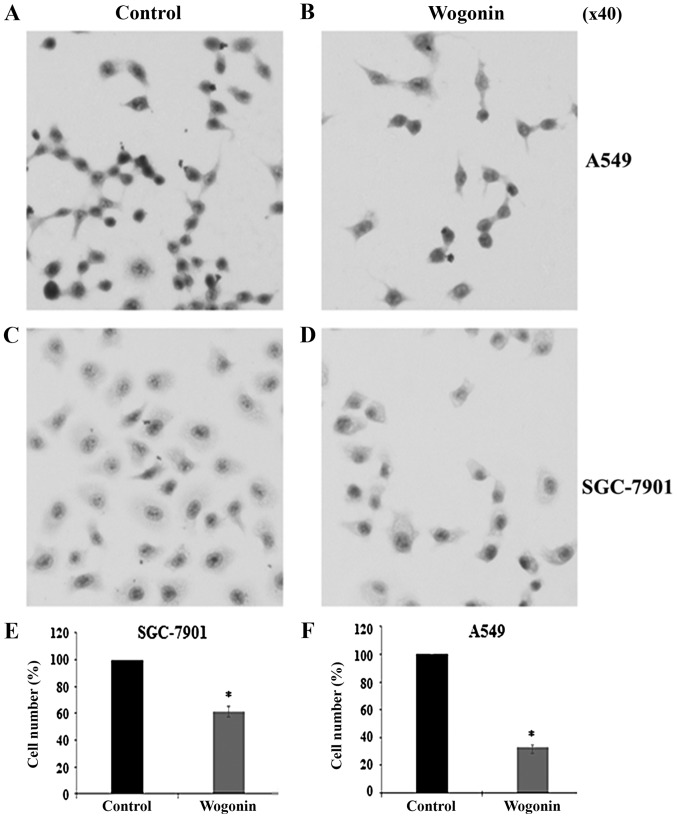
H&E staining of A549 and SGC-7901 cells. H&E staining of (A) untreated A549 cells and (B) A549 treated with wogonin (15 µg/ml; magnification, ×40). H&E staining of (C) untreated SGC-7901 cells and (D) SGC-7901 treated with wogonin (15 µg/ml; magnification, ×40). Cell numbers in the control and wogonin-treated group for (E) A549 and (F) SGC-7901 cells, with the cell number in control group set as 100%. *P<0.05 vs. control; n=4. H&E, hematoxylin and eosin.

