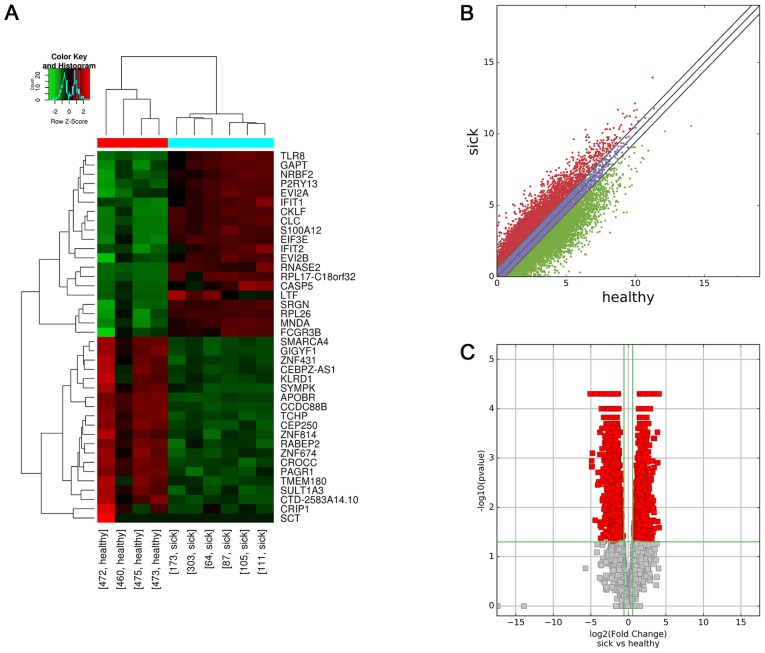
Figure 2.
Differential expression of mRNAs between the two groups. (A) Hierarchical clustering analysis of 40 differentially expressed mRNAs from each sample. FC≥1.5 indicated upregulation and <0.67 indicated downregulation. (B) Scatter plot of differential expression of mRNAs between the HSPN and HC libraries. Red indicates upregulated mRNAs [log2(HSPN/HC)>0], blue indicates mRNAs with no change in expression between HSPN and HC libraries, green indicates downregulated mRNAs [log2(HSPN/HC)<0]. (C) Volcano plot of differential mRNA expression. The vertical green lines delineate a 1.5-fold upregulation and 0.67-fold downregulation of mRNAs, and the horizontal line represents P=0.05. Red plots on the right side represent 1,232 upregulated mRNAs with FC≥1.5 and corrected P<0.05. Red plots on the left side represent 2,325 downregulated mRNAs with FC<0.67 and corrected P<0.05. HSPN, Henoch-Schönlein purpura nephritis; HC, healthy controls; FC, fold change.

