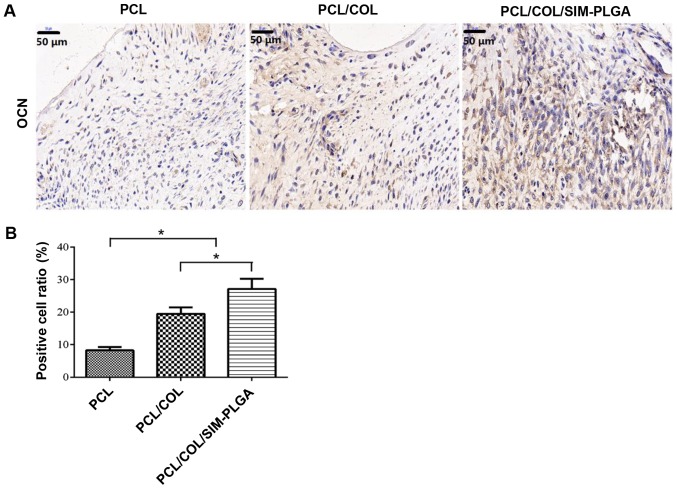
Figure 9.
Expression of OCN in the defect area. (A) Representative images of immunohistochemical staining of OCN. (B) Percentage of positively stained cells per field of view was calculated. The PCL/COL/SIM-PLGA group exhibited the greatest levels of OCN staining. *P<0.05, as indicated. PLGA, poly(lactic-co-glycolic acid); SIM, simvastatin; COL, collagen; PCL, poly(ε-caprolactone); OCN, osteocalcin.

