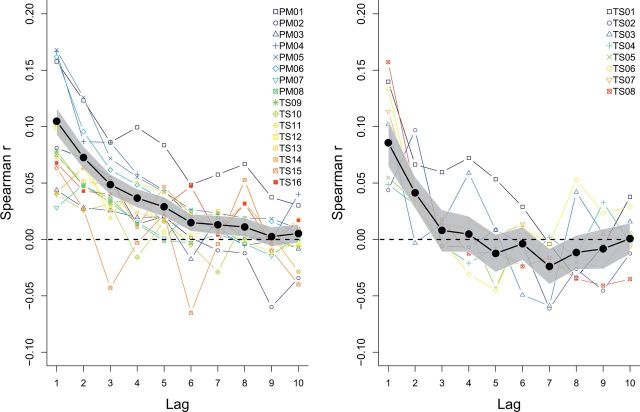
Figure 3.
Aggregated serial correlation data for the fixed (left) and variable (right) eye experiments. Mean Spearman rank correlations across all observers as a function of lag. The gray, shaded area indicates the 95% bootstrapped confidence intervals. The colored lines depict the mean Spearman rank correlations for each experiment separately.

