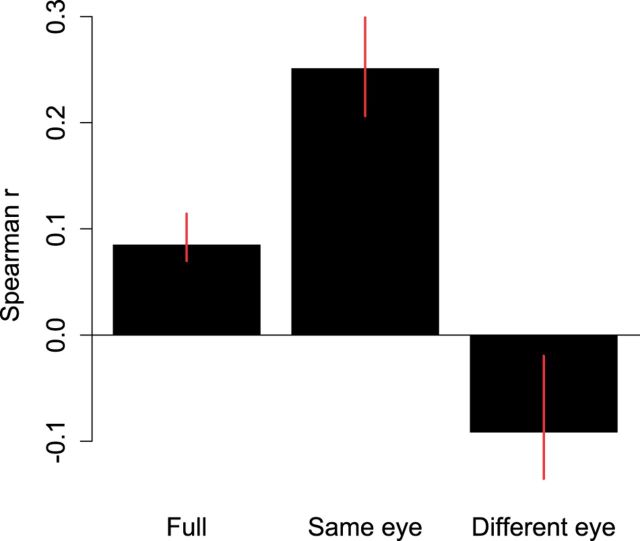
Figure 4.
Lag 1 correlation analysis for the variable eye experiments. The bar plot depicts the lag 1 Spearman correlations for the full dataset (as depicted in Figure 3), and the dataset split up in trials in which the CFS mask was always presented to the same or different eye on the previous trial. The same eye trials contribute significantly to the positive lag 1 correlations. Error bars denote 95% confidence intervals.

