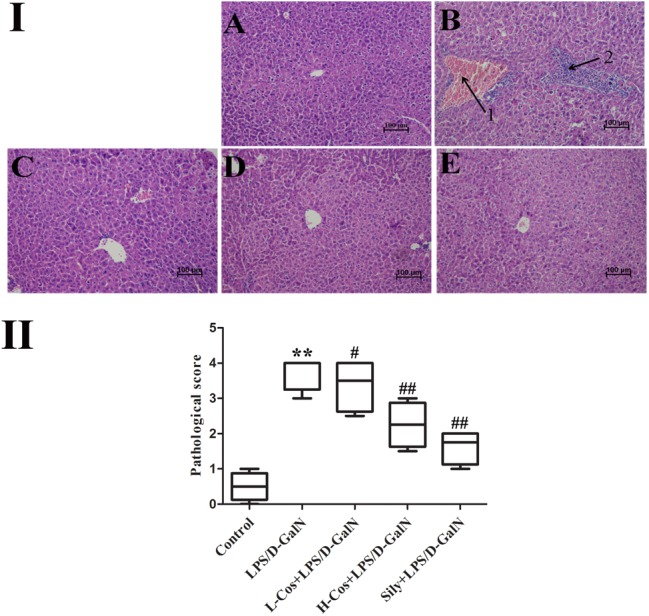
FIGURE 3.

Effects of cos on liver histology in mice. (I) The histopathological changes of liver. (I-A) Control, (I-B) LPS/D-GalN (LPS 50 μg/kg; D-GalN: 400 mg/kg; arrow 1: central venous hyperemia; arrow 2: inflammatory infiltration), (I-C) LPS/D-GalN + L-cos (I-B + cos 20 mg/kg), (I-D) LPS/D-GalN + H-cos (I-B + cos 40 mg/kg), (I-E) LPS/D-GalN + sily (I-B + cos 40 mg/kg) (magnification: 200×). (II) The scores of the liver injury in the mice after treated with cos. The data represented as mean ± SD (n = 10). ∗∗P < 0.01 vs. Control group; #P < 0.05, ##P < 0.01 vs. LPS/D-GalN group.
