
FIGURE 5.
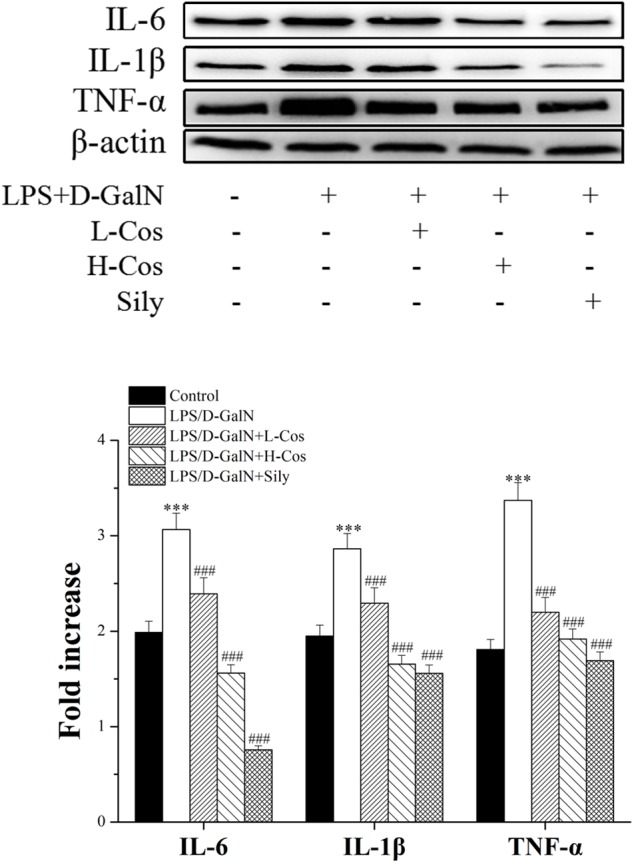
Effects of cos on the expression of TNF-α, IL-6, and IL-1β after LPS/D-GalN administration by western blot analysis. The data represent the mean ± SD (n = 10). ∗∗∗P < 0.001 vs. control group; ##P < 0.01 and ###P < 0.001 vs. LPS/D-GalN group.