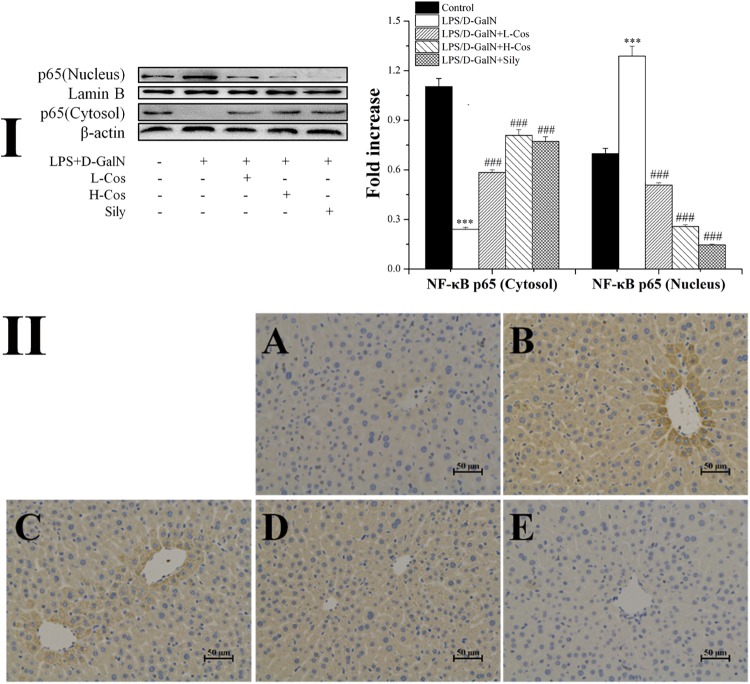
FIGURE 7.
Effects of cos on the expression of p65 protein. (I) Western blot analysis of cytosol and nucleus p65 proteins. (II) Immunohistochemistry analysis of NF-κB (p65). (II-A) Control; (II-B) LPS/D-GalN (LPS 50 μg/kg; D-GalN: 400 mg/kg); (II-C) LPS/D-GalN + L-cos (II-B + cos 20 mg/kg); (II-D) LPS/D-GalN + H-cos (II-B + cos 40 mg/kg); (II-E) LPS/D-GalN + sily (II-B + sily 20 mg/kg). The density values of the western blot were normalized for β-actin and Lamin B. ∗∗∗P < 0.01 vs. control group, ###P < 0.01 vs. LPS/D-GalN group.

