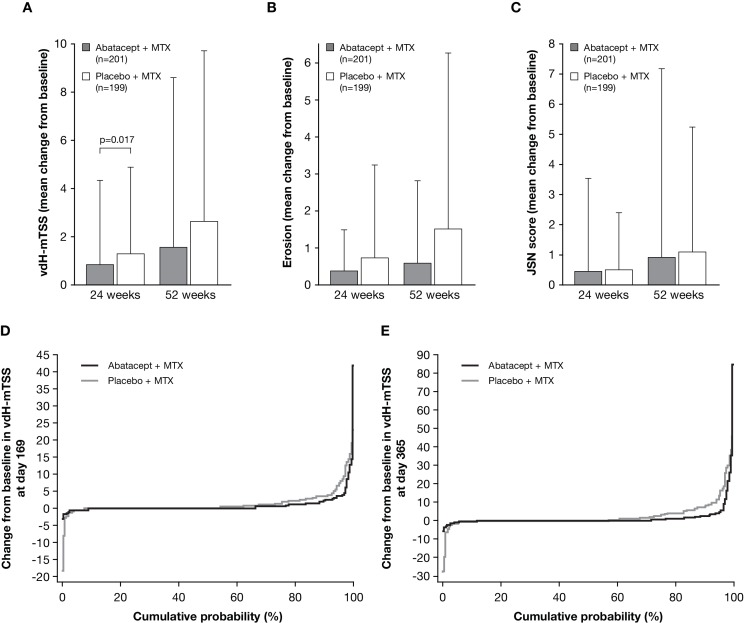
Figure 3.
Joint damage progression evaluated as a comparison between abatacept plus MTX (grey bar) and placebo plus MTX groups (open bar). (A) The change from baseline in vdH-mTSS at week 24 (co-primary endpoint) and week 52. P value is based on a rank-based non-parametric analysis of covariance method. (B) The change from baseline in erosion score at week 24 and week 52 (tertiary endpoints). (C) The change from baseline in JSN score at week 24 and week 52 (tertiary endpoints). Data are shown as mean (SD). The number of patients with both baseline and post-baseline measurement are indicated in A–C. (D–E) Cumulative distribution function plot for the change from baseline in vdH-mTSS at week 24 (D) and week 52 (E). Missing data with patients who received rescue abatacept treatment, or who withdrew for any reason, were imputed with linear extrapolation. JSN, joint-space narrowing; MTX, methotrexate; vdH-mTSS, van der Heijde-modified total Sharp score.

