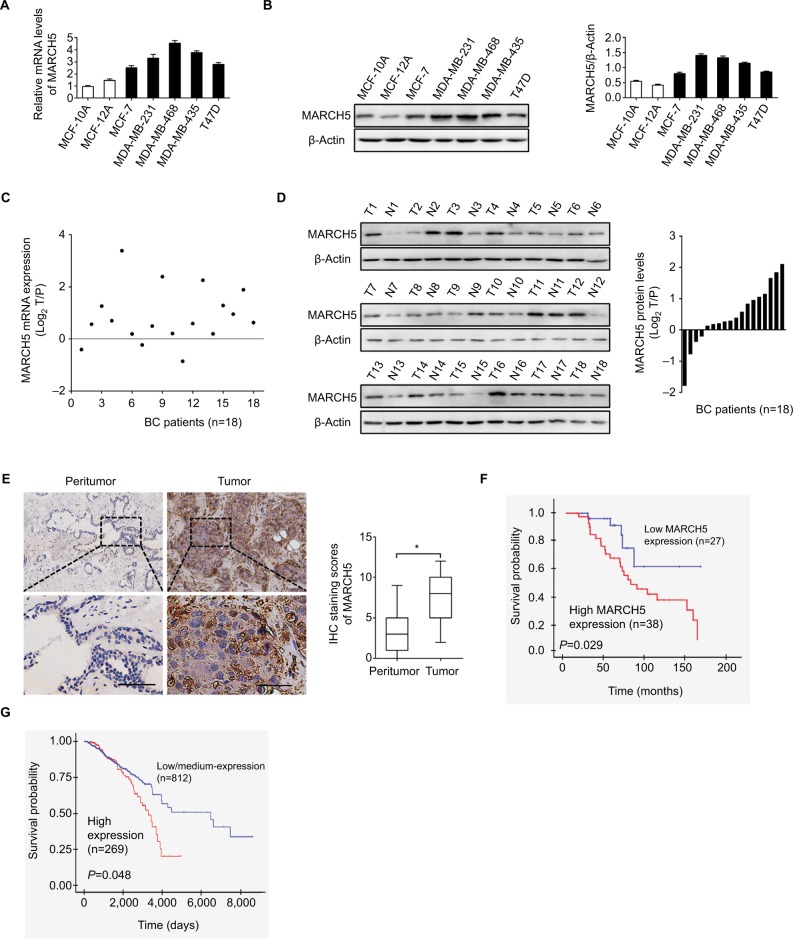
Figure 1.
MARCH5 is upregulated in BC cells and contributes to worse prognosis.
Notes: (A and B) Quantitative real-time PCR and Western blot assays for expressions of MARCH5 in five BC cell lines (MDA-MB-231, MDA-MB-468, MDA-MB-435, MCF-7, and T47D) and two nonmalignant human breast cell lines (MCF 10A and MCF 12A). (C and D) Quantitative real-time PCR and Western blot assays for expressions of MARCH5 in 18 paired BC tumor tissues and peritumor tissues (T, tumor; P, peritumor). Scale bars, 50 µm. The relative MARCH5 expression ratio of tumor to peritumor was log2-transformed. (E) Representative immunohistochemical (IHC) staining images (left panel, scale bar, 50 µm) and staining intensities (right panel) of MARCH5 in tumor and peritumor tissues from 65 BC patients. (F) Kaplan–Meier curve for survival analysis of 65 BC patients according to their MARCH5 expression levels. (G) Prognostic significance analysis for MARCH5 in BC using the online web portal UALCAN (http://ualcan.path.uab.edu). *P<0.05.
Abbreviation: BC, breast cancer.

