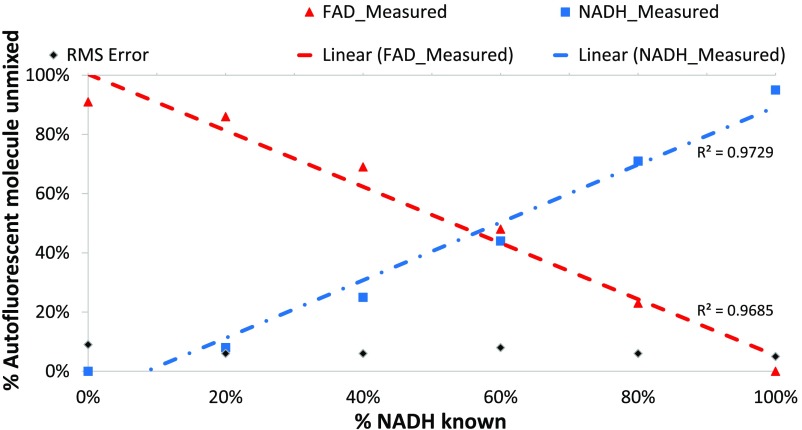
Fig. 3.
The linearity of response of excitation-scanning hyperspectral imaging and linear unmixing was evaluated using mixtures of autofluorescent molecules, FAD and NADH. First, concentrations for FAD and NADH were determined that produced an equivalent intensity spectral response while ensuring linear optical interactions ( FAD and NADH). Based on these total concentrations, mixtures of FAD and NADH were prepared as a percent of the equivalent response concentration (e.g., 20% FAD and 80% NADH). Mixtures were imaged using excitation-scanning spectral imaging and linearly unmixed. Unmixed abundances of FAD (red triangles) and NADH (blue squares) were plotted as a function of % NADH in the prepared mixture. Linear fit of the abundances was also performed (FAD = red dashed line, NADH = blue dot-dashed line). RMS error is represented by black diamonds.

